Research Articles A new tool to rethink food environments for better health outcomes

As food systems transformation gathers pace globally, one question remains central: How do we measure people’s food environments that shape their food choices and health? In a newly published paper, we introduce the Nutrition-Sensitive Food Environment Index (N-FEI); a new, data-driven tool designed to assess food environments by linking food diversity, accessibility, infrastructure, and ultimately malnutrition risk.
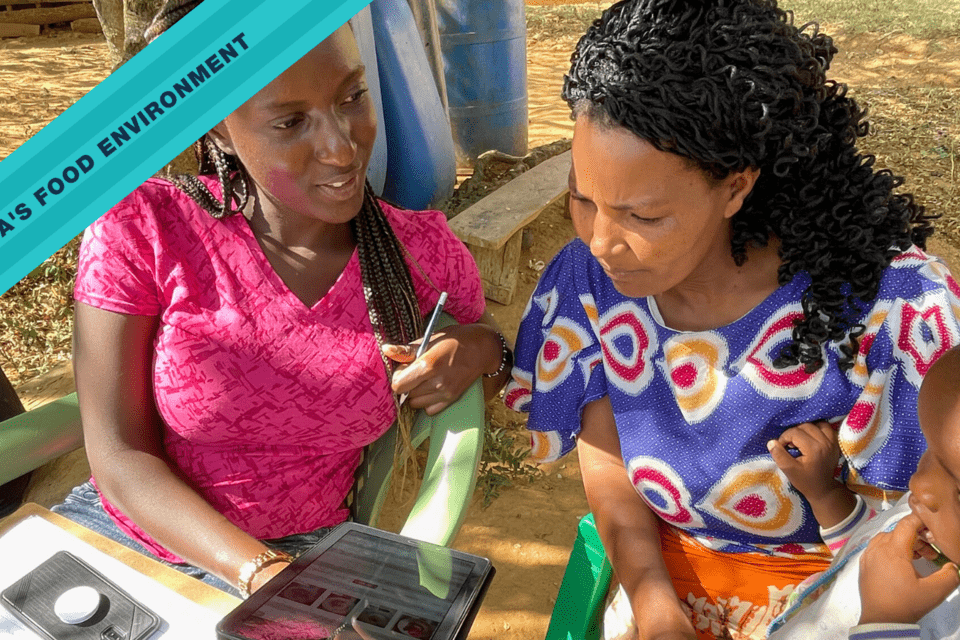
We used data from over 17,000 food vendors across six countries: Benin, Côte d’Ivoire, Ethiopia, Kenya, Uganda and Vietnam. The analysis combined machine learning, spatial analysis and rigorous statistical testing, to project malnutrition risks associated with the built food environment – measured with the N-FEI. The results show that the N-FEI offers a powerful lens for researchers, governments, and development practitioners to assess, compare, and improve food environments across diverse settings.
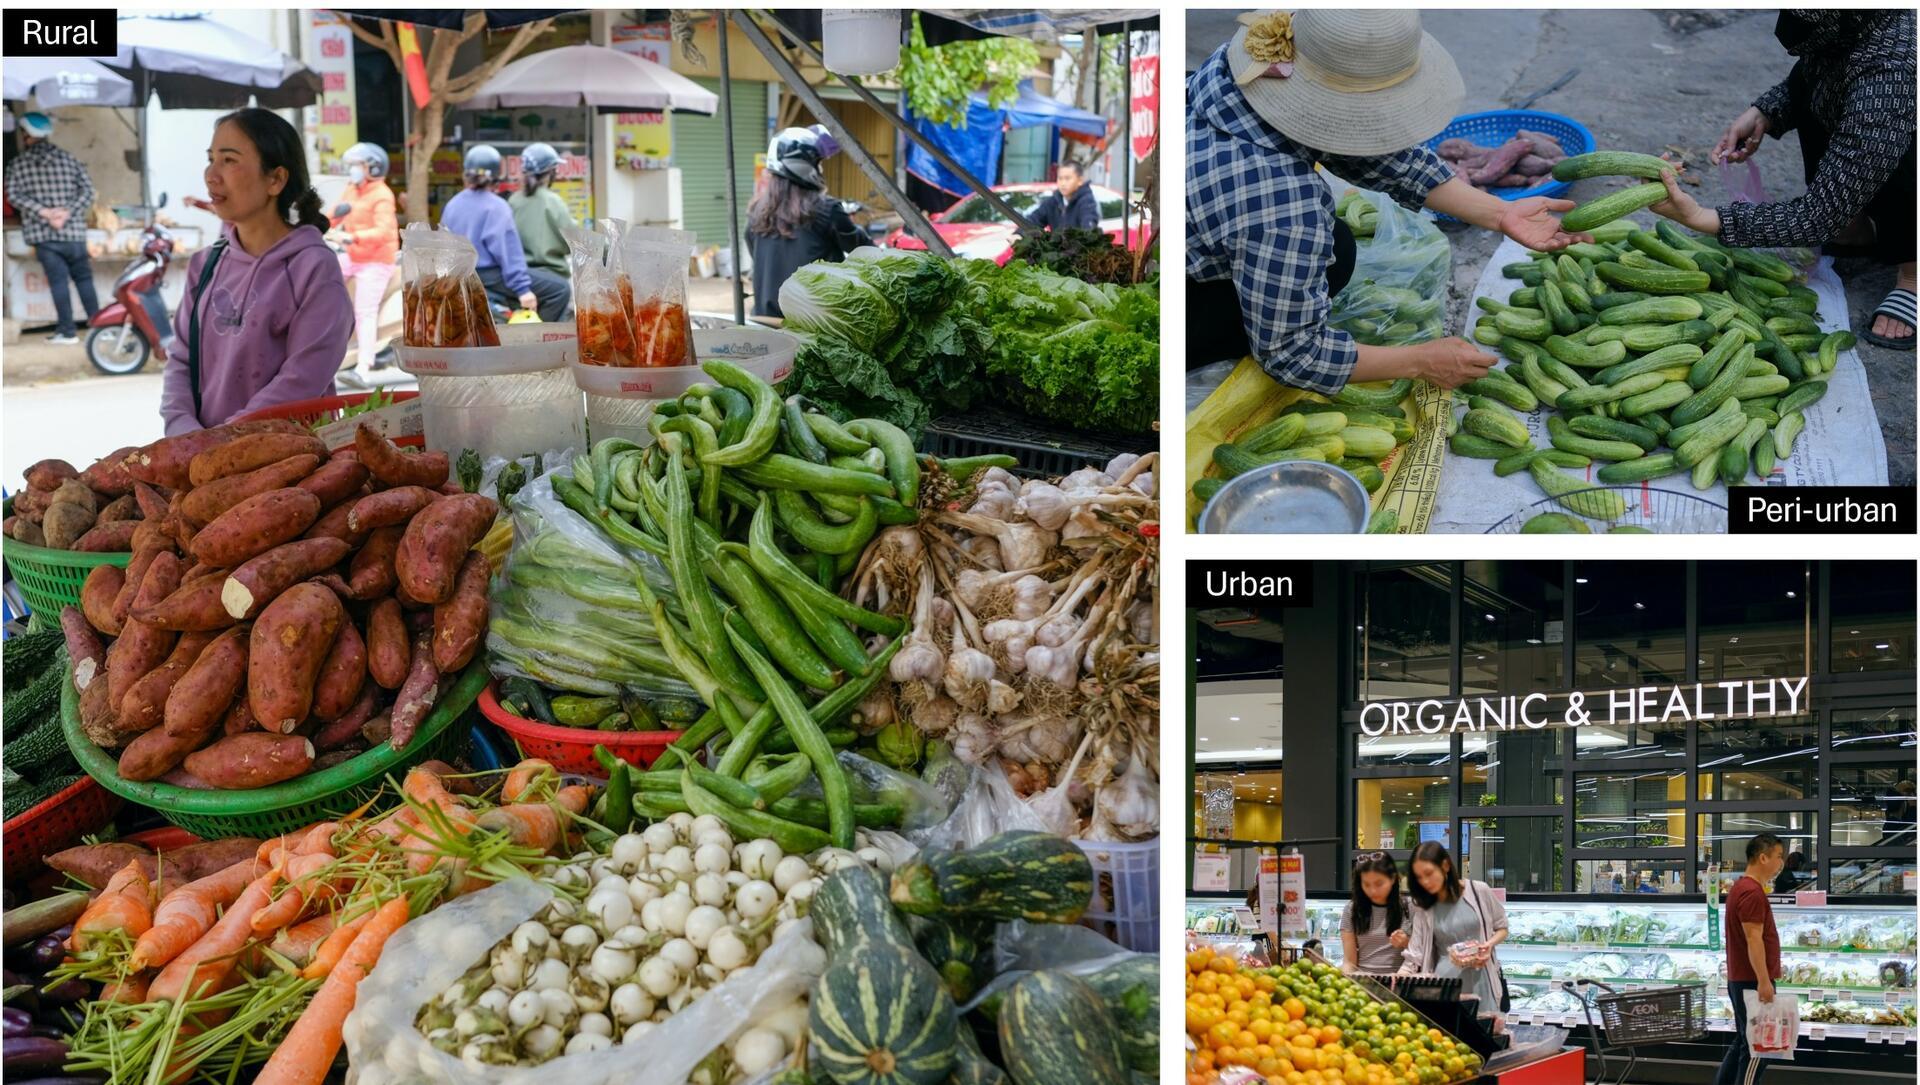
Rural, peri-urban, and urban settings of Vietnam. Photos: Ha Dao/CIAT.
Why the N-FEI matters
Food environments are complex: They are shaped by who sells what, where, how accessible diverse food is, and under what conditions the food is offered. Until now, most indices have narrowly focused on affordability or retail availability, often missing key dimensions of food diversity, access to water and sanitation, and vendor density, all of which affect nutrition outcomes.
The N-FEI bridges this gap by providing a measure which is associated with malnutrition risks of the population in the study regions. It is a simple and comprehensive tool designed to reflect the realities of food access, especially in underserved or informal settings where traditional data collection is hard, and health risks are high.
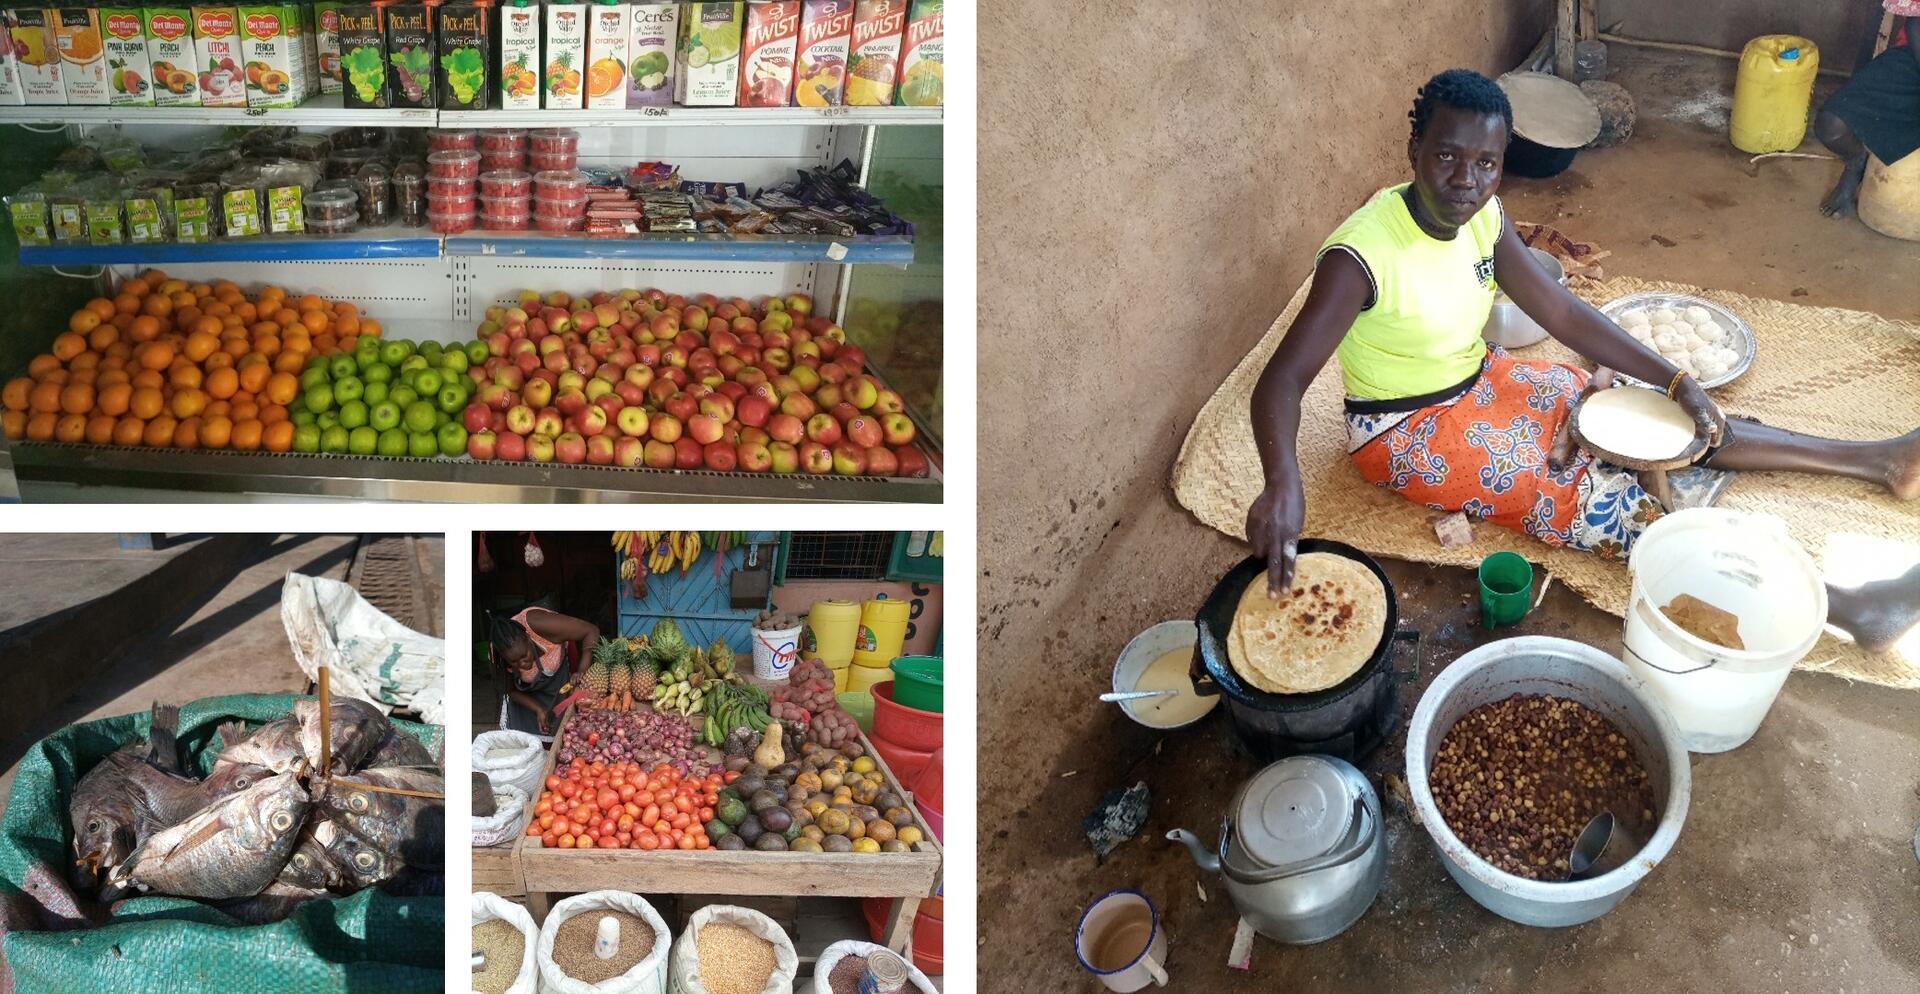
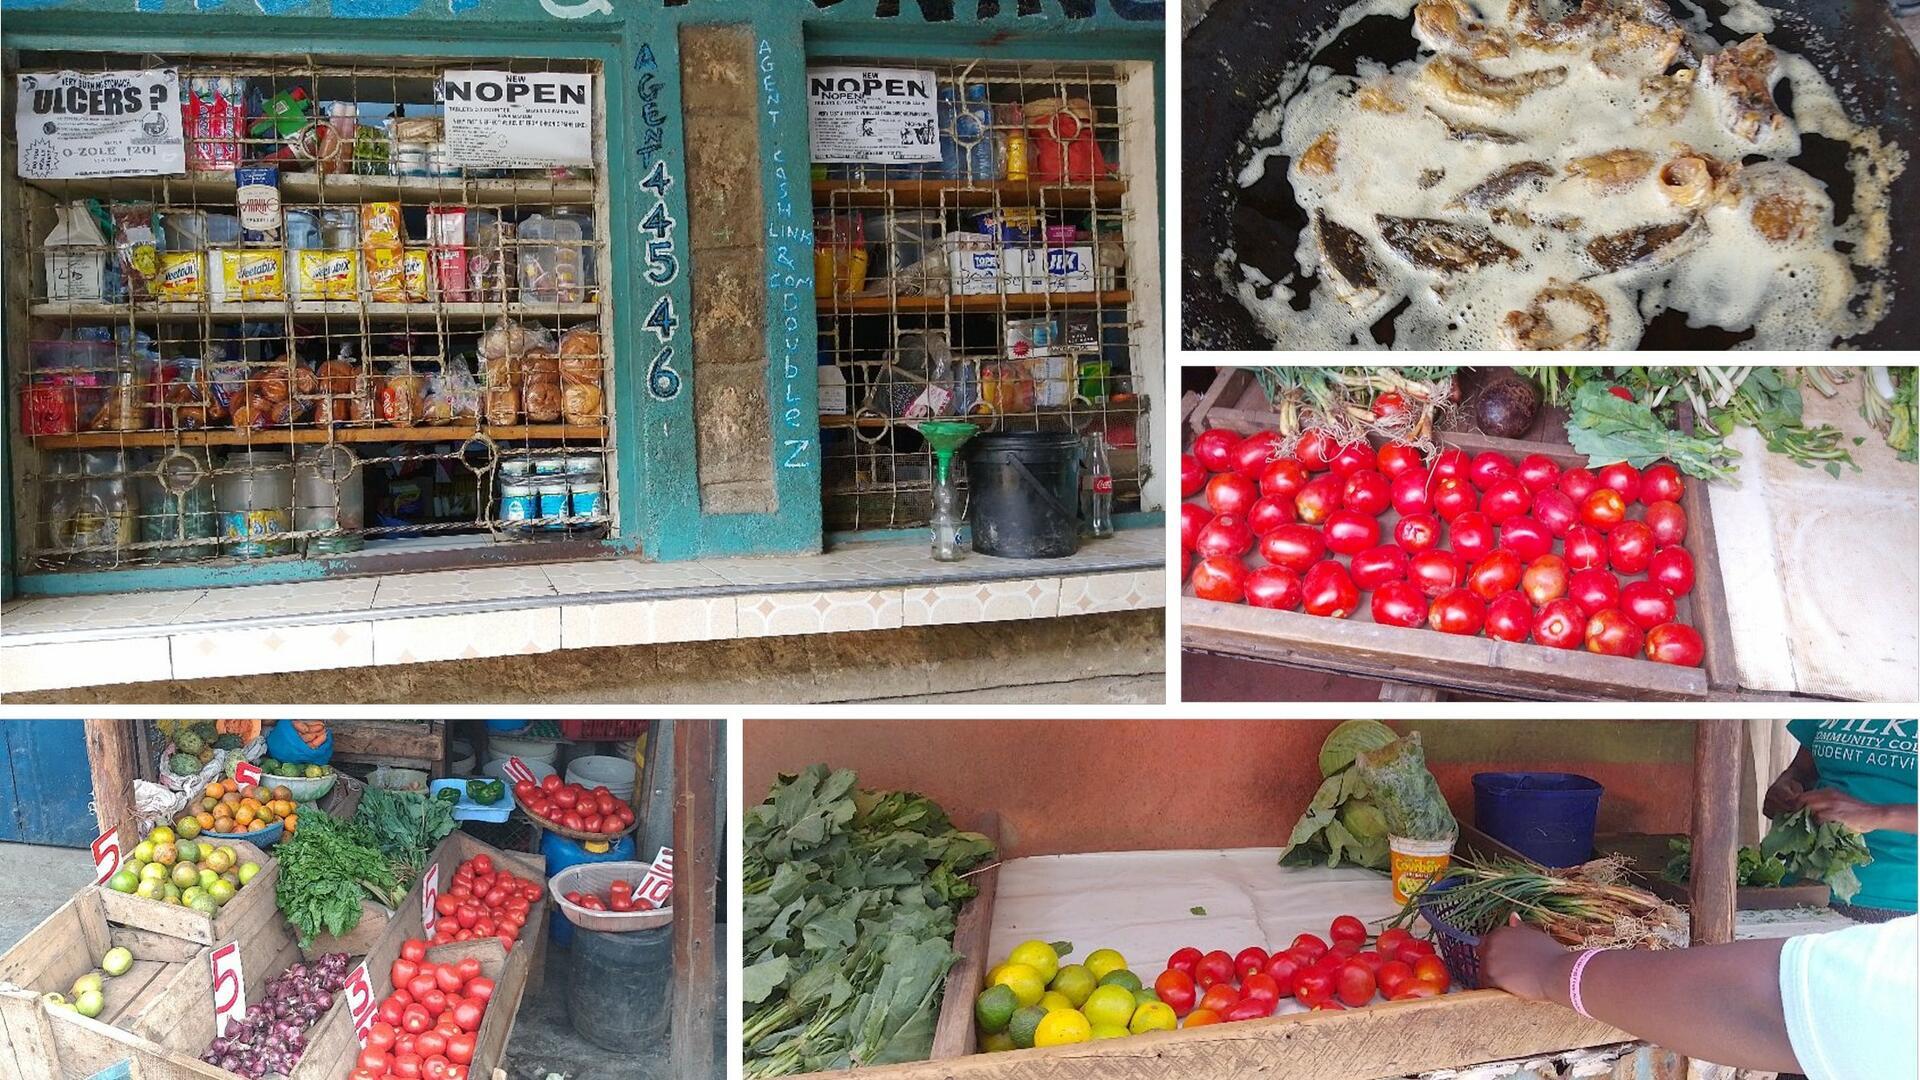
Turkana county, Kenya. Photos collected by the enumerators during data collection/Bioversity International.
What makes N-FEI different?
The N-FEI goes beyond traditional food environment metrics by including nine core indicators grouped into two major domains:
Food diversity and quality at vendor level and vendor environment
- Vendor Healthy Food Diversity Score (VHFDS)
- ProColor Diversity (a color-based fruit/vegetable diversity metric)
- Count of unhealthy food and beverage items
Vendor and environmental access
- Vendor availability (daily and weekly operation)
- Vendor density (per km² and per population)
- Access to sanitation facilities within 500 meters
What’s unique is how N-FEI zooms out to consider not just individual vendors, but the food environment within a 50-meter walking radius, capturing how consumers truly engage with food choices.
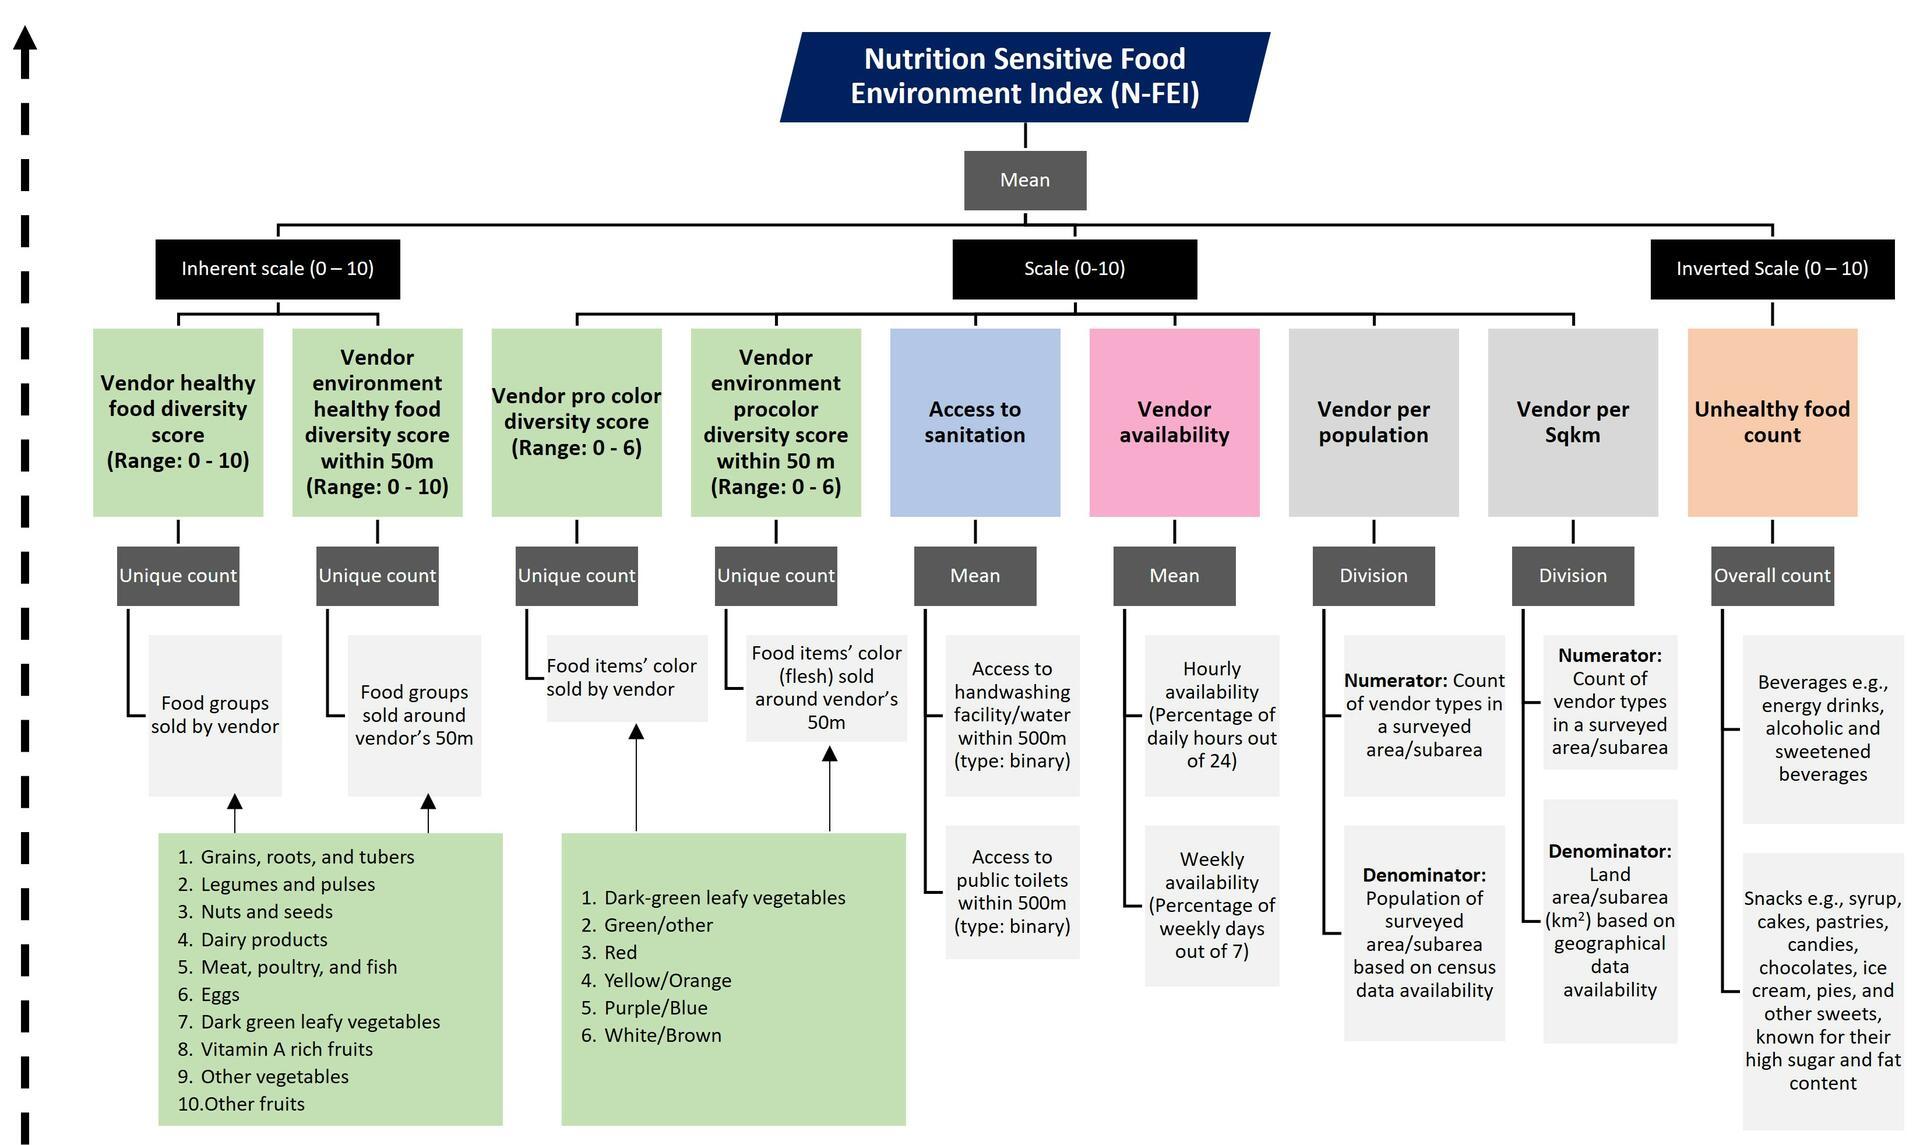
Overview of the Nine Indicators and the Scores Used to Compute the Nutrition-Sensitive Food Environment Index (N-FEI). (Colour code for indicators: green is related to healthy food options, light blue reflects the availability of water and sanitation facilities, pink is related to vendor availability, grey reflects vendor density, and peach reflects unhealthy food options)
We applied machine learning (XGBoost) and spatial analytics to link these indicators with health outcomes from Demographic and Health Surveys (DHS) to model the relationship between food environment features and health outcomes. We also conducted different robustness tests to validate the stability of the index (See article).
What did we find?
The index is statistically stable, interpretable, and scalable, even when applied across rural and urban settings in Africa and Southeast Asia from the robustness test conducted. N-FEI scores varied widely across the different study sites. Urban informal settlements like Viwandani (Nairobi, Kenya) had the highest N-FEI scores, which reflect overall better nutrition-sensitive food environments. This was largely due to strong vendor diversity and better infrastructure; positive contributors that outweighed the presence of unhealthy food options that was equally found, which, though included in the index, were adjusted such that lower exposure contributed positively to the overall score. The study sites in Turkana (rural area) in Kenya had the lowest, reflecting critical gaps in access, hygiene, and healthy food options. Urban districts in Vietnam and Ethiopia generally performed better than their peri-urban or rural counterparts.
Viwandani, Nairobi, Kenya. Photos collected by the enumerators during data collection/Bioversity International.
Vendor type mattered too. Stalls and tabletop vendors were significantly associated with better N-FEI scores than mobile or drink-only vendors, revealing how structure and product range affect the quality of food environments.
Health outcomes like stunting, anaemia, and Body Mass Index (BMI) show powerful predictive associations. In some models, food environment features explained up to 94% of the variation in women’s anaemia risk and over 90% of BMI variability.
These patterns are both intriguing and actionable by enabling evidence based and targeted interventions.
What’s driving malnutrition risks?
Our explainable artificial intelligence model (via SHAP analysis) showed that:
- Vendor density (number of vendors per km²) was the strongest predictor across all health risks.
- Access to sanitation played a major role in reducing stunting and anaemia.
- Vendor availability and diversity within 50m emerged as key protectors against different forms of malnutrition.
- Collective vendor food diversity within a neighborhood mattered more than individual vendors food diversity.
In essence: it’s not just what one vendor sells, but what the environment offers as a whole.

Vietnam. Photo: Ha Dao/CIAT.
From tool to transformation
The N-FEI is more than an academic tool: it is designed with policy application in mind. Its simplicity, flexibility, and low cost make it ideal for scaling across countries, especially where detailed dietary data or nutrition surveillance systems are scarce.
It can be used to monitor food system transformations, identify malnutrition risk hotspots, guide urban planning and market infrastructure, support surveillance on exposure to ultra-processed foods, and overlay with nutrition data for policy targeting and intervention.
Because it relies on observable data (not consumer surveys), it is also suitable for rapid assessments, including in fragile or resource-constrained settings.
What is next?
While the index already performs robustly, we are exploring next steps, including:
- Integrating environmental indicators like solid waste or single-use plastics,
- Tailoring the index for urban vs. rural dynamics,
- Embedding it into national food environment surveillance systems, and
- Using it alongside consumer behavior data to better understand affordability and dietary impact.
We believe the N-FEI has strong potential to redefine how countries measure and act on food environments, and we hope it empowers stakeholders at all levels from local authorities to global policymakers to make more informed, targeted and effective decisions.
Explore more:
Read the full paper here: https://doi.org/10.55845/jos-2025-1116
The N-FEI was developed within the Healthy Diet for Africa Project (HD4A), which is funded by the European Unit (No. 01083388 - HORIZON-CL6-2022-FARM2FORK-01). Most of the databases used in this study were generated by the Food Environment and Consumer Behaviour Africa Hub of the Alliance Bioversity & CIAT (Nairobi) in various projects funded by the European Union, Biovision Foundation Switzerland, and the German Federal Ministry for Economic Cooperation and Development. The datasets from Ethiopia and Vietnam used to develop the N-FEI were generated by the work of the CGIAR Research Initiative on Sustainable Healthy Diets through Food Systems Transformation (SHiFT). SHiFT is funded by the CGIAR Trust Fund (https://www.cgiar.org/funders/) and is led by the International Food Policy Research Institute (IFPRI) and the Alliance of Bioversity International and CIAT, in partnership with Wageningen University and Research (WUR), with contributions from the International Potato Center (CIP). All listed funders covered the staff time of the study authors.
To learn about our tools and approach, get in touch with the Food Environment and Consumer Behavior Research Area at the Alliance of Bioversity and CIAT:
Tosin Harold Akingbemisilu
Research Specialist
Irmgard Jordan
Senior Researcher Consultant
Deborah Nabuuma
Scientist I
Nicanor Odongo
Research Fellow
Kevin Omondi Onyango
Senior Research Associate
Ermias Tesfaye Teferi
Postdoctoral Fellow
Casey Tokeshi
Research Specialist
Mark Lundy
Director, Food Environment and Consumer Behavior