Blog When the rains don't follow the calendar

A 'normal' season can still catch farmers off guard. New analysis of five years of Kisumu rainfall data uncovers the hidden variability behind the averages, reinforcing T-CSIA's irrigation advisory work under the iSPARK project.
Five years of monthly rainfall data for Kisumu look mostly like noise with sharp shifts and no clean trend. But underneath that noise are real, documented events, such as specific months when rain came late, stopped early, or fell in the wrong week for a crop that needed it on time. For farmers, that gap between "normal" and "what actually happens" is the difference between a good season and a lost one. A month that looks safe on paper, because it's usually wet, can still fail without warning, and by the time it's obvious something's wrong, the planting window has already closed.
This analysis draws on five years (2018–2022) of monthly Kisumu rainfall estimates from Climate Hazards Center InfraRed Precipitation with Station (CHIRPS), a satellite-and-station rainfall product. Using time-series methods, the data is explored to tell a real climate signal apart from ordinary noise.
In the following sections, we share the fuller picture, not just what the rainfall looked like, but how consistent, or inconsistent, it really was, month by month and year by year. For one anomaly, we go further to understand what was happening on the ground at the time, using Kenya's own agricultural monitoring records.
This is a quick exploration of what five years of rainfall data for Kisumu can (and can't) tell us.
The big picture
The data comes from CHIRPS data, an open-access product from the USGS/UCSB Climate Hazards Center that blends satellite imagery with ground-station readings to estimate rainfall across Africa. We used monthly totals for Kisumu, January 2018 to December 2022 resulting to 60 months. There's no steady rise or fall over the five years, but in most of the studied years, rainfall totals to over 350mm some months and under 50mm others.
In Kisumu, a very wet month can be followed just weeks later by a near-dry one, and while it's happening, there's no way to know if that's normal or the start of real trouble. That's why planting decisions, advisories, and planning can't rely on 'normal' rainfall alone; watching the season as it unfolds is what catches a problem in time to act.
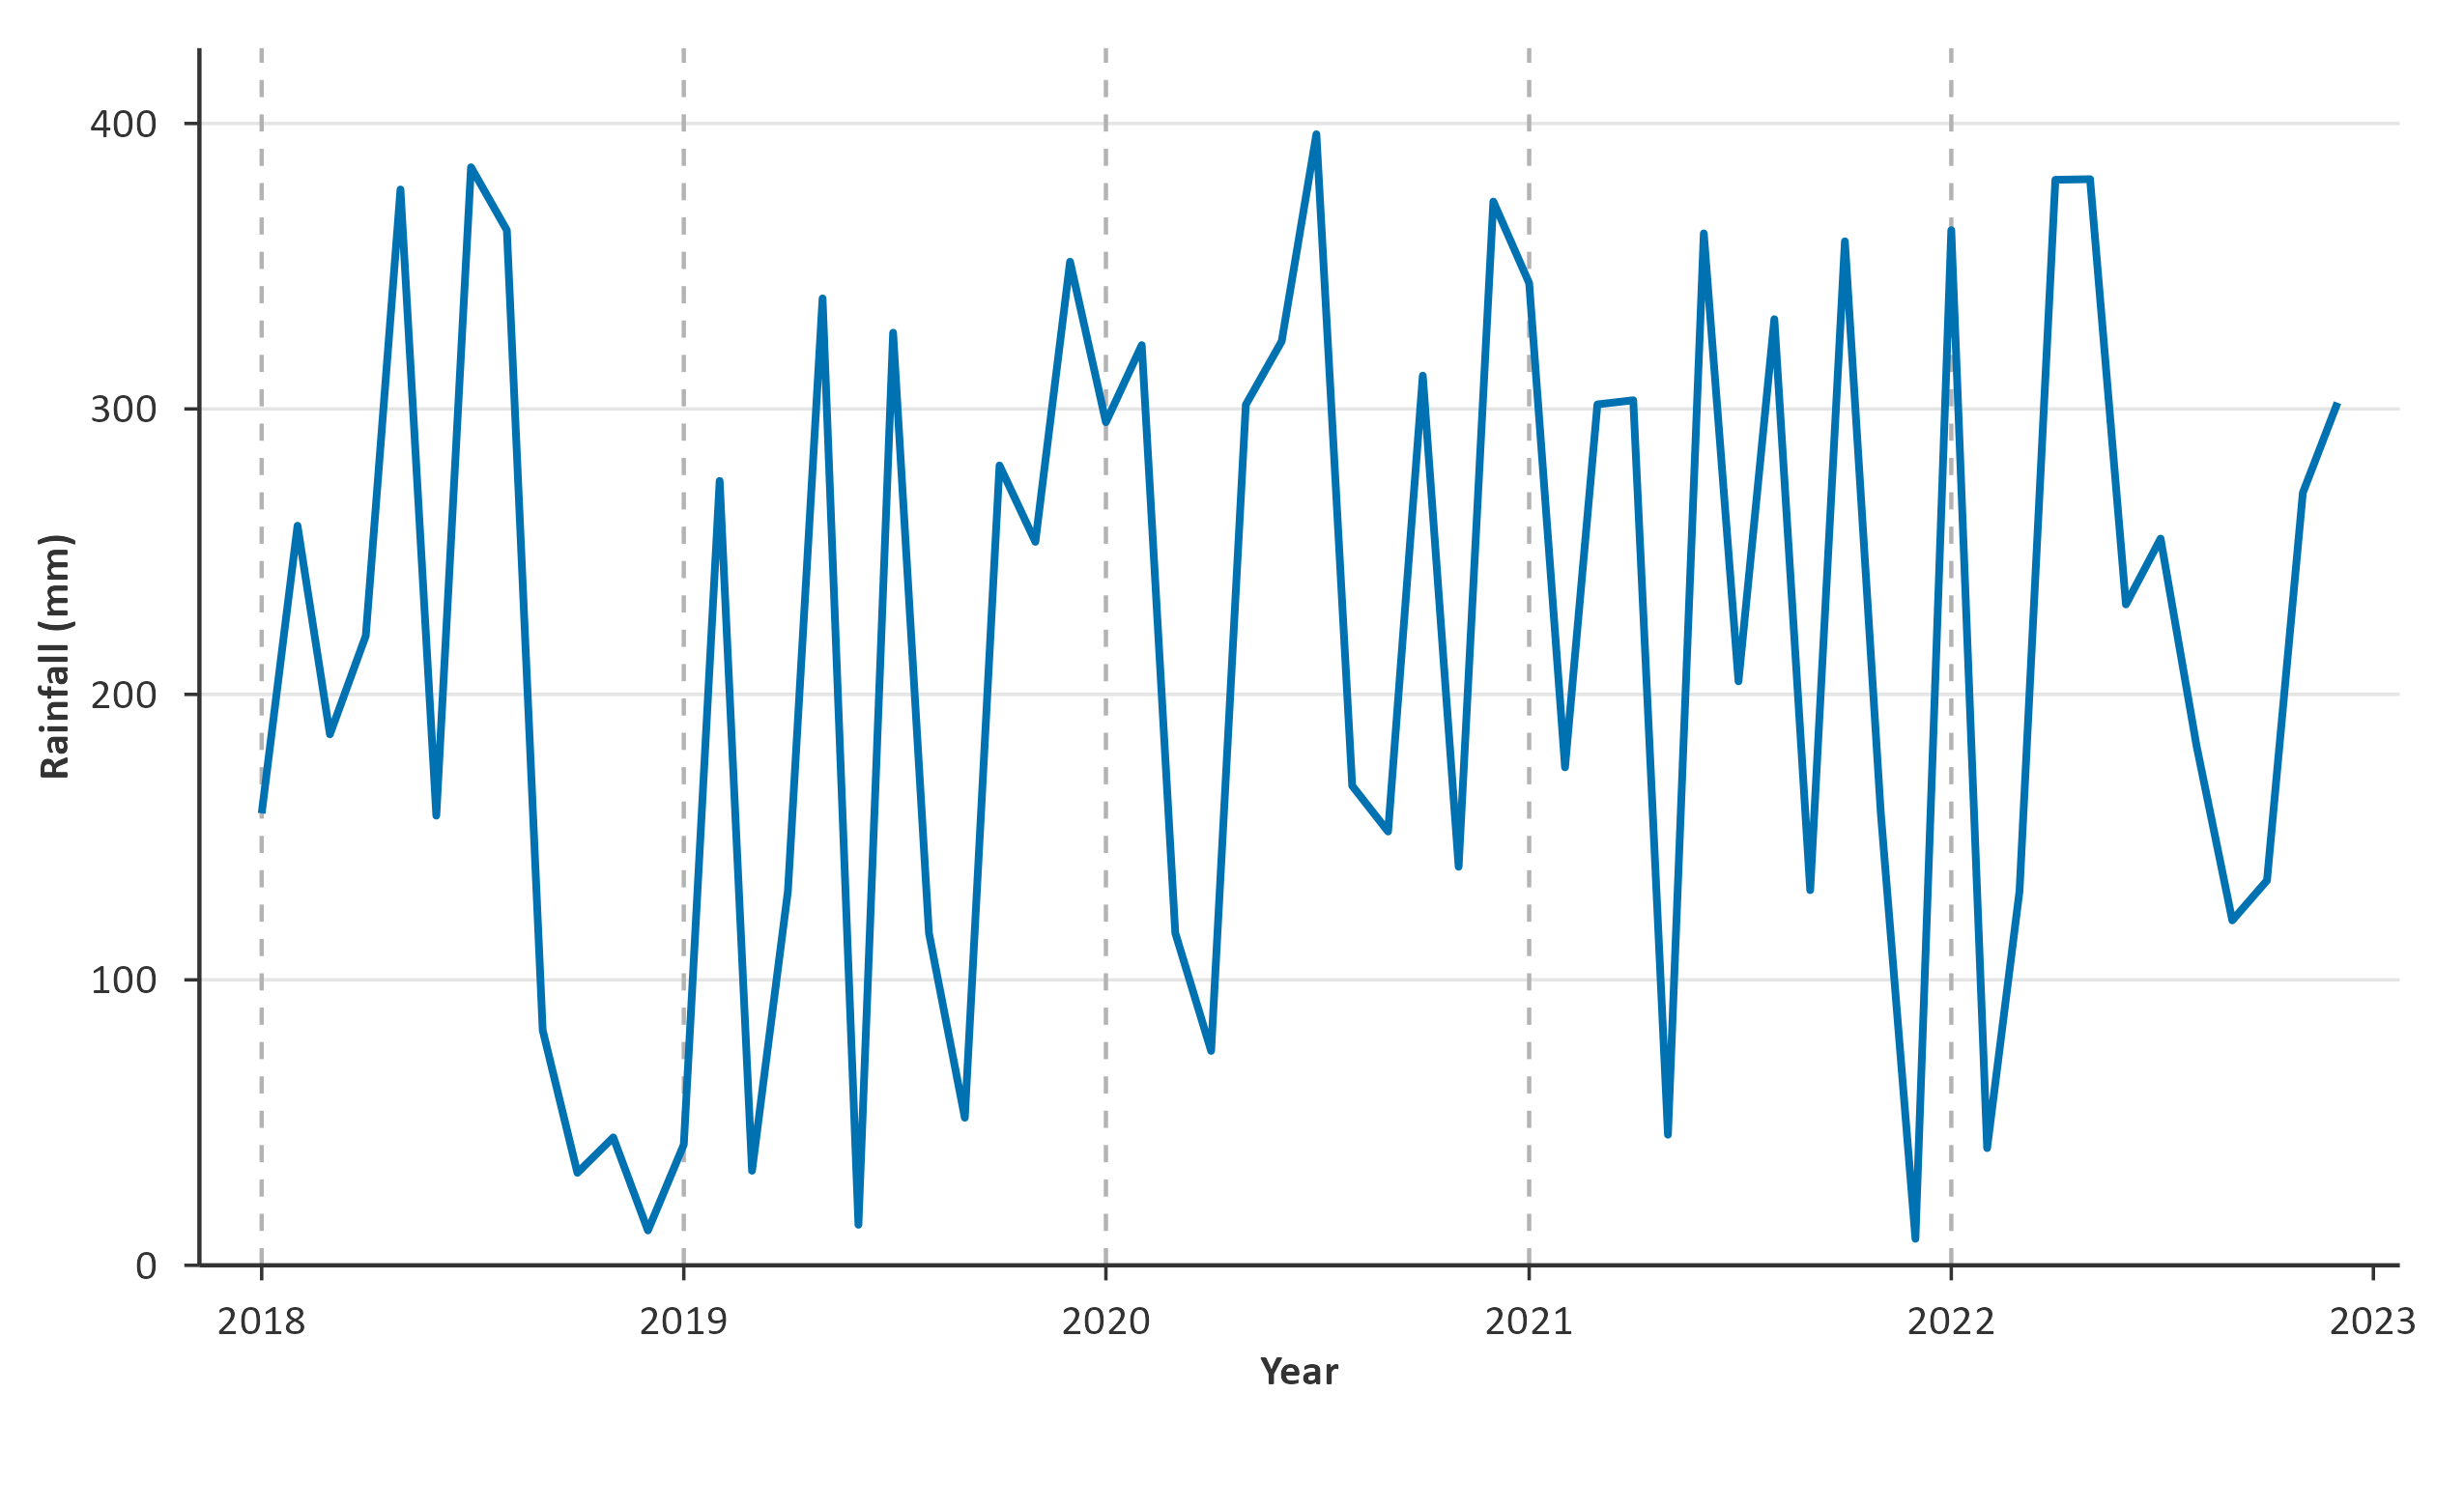
Figure 1. Monthly rainfall in Kisumu, Kenya, 2018–2022. Source: CHIRPS.
Two ways to see the same variability
Knowing how much rain a season brings isn't the same as knowing when it will arrive, and for farmers, timing is usually the harder problem. Research across the Lake Victoria Basin has documented growing intra-seasonal rainfall variability, delayed onset, and more frequent dry spells (Kenduiywo et al., 2026). The two views displayed in Figure 2 and Figure 3 below answer two different timing questions, from two different angles.
From Figure 2, each of the five small charts traces one year's rainfall month by month. This visual is useful for spotting a year, like 2021, that broke from the usual pattern. On the other hand, each panel in Figure 3 traces one calendar month across all five years, with an orange line marking that month's five-year average. This is useful for checking how much a given month's rainfall varies over the five years, e.g., does May look like May every year, or is every May a surprise?
Kisumu's long rains run March–May, and in four of five years, May sits at or near a seasonal peak (Figure 2). In 2021, rainfall in May collapsed to under 50mm, causing a sharp dip in the middle of the main rainy season. This is exactly the kind of anomaly a farmer relying on “normal” timing would have felt directly.
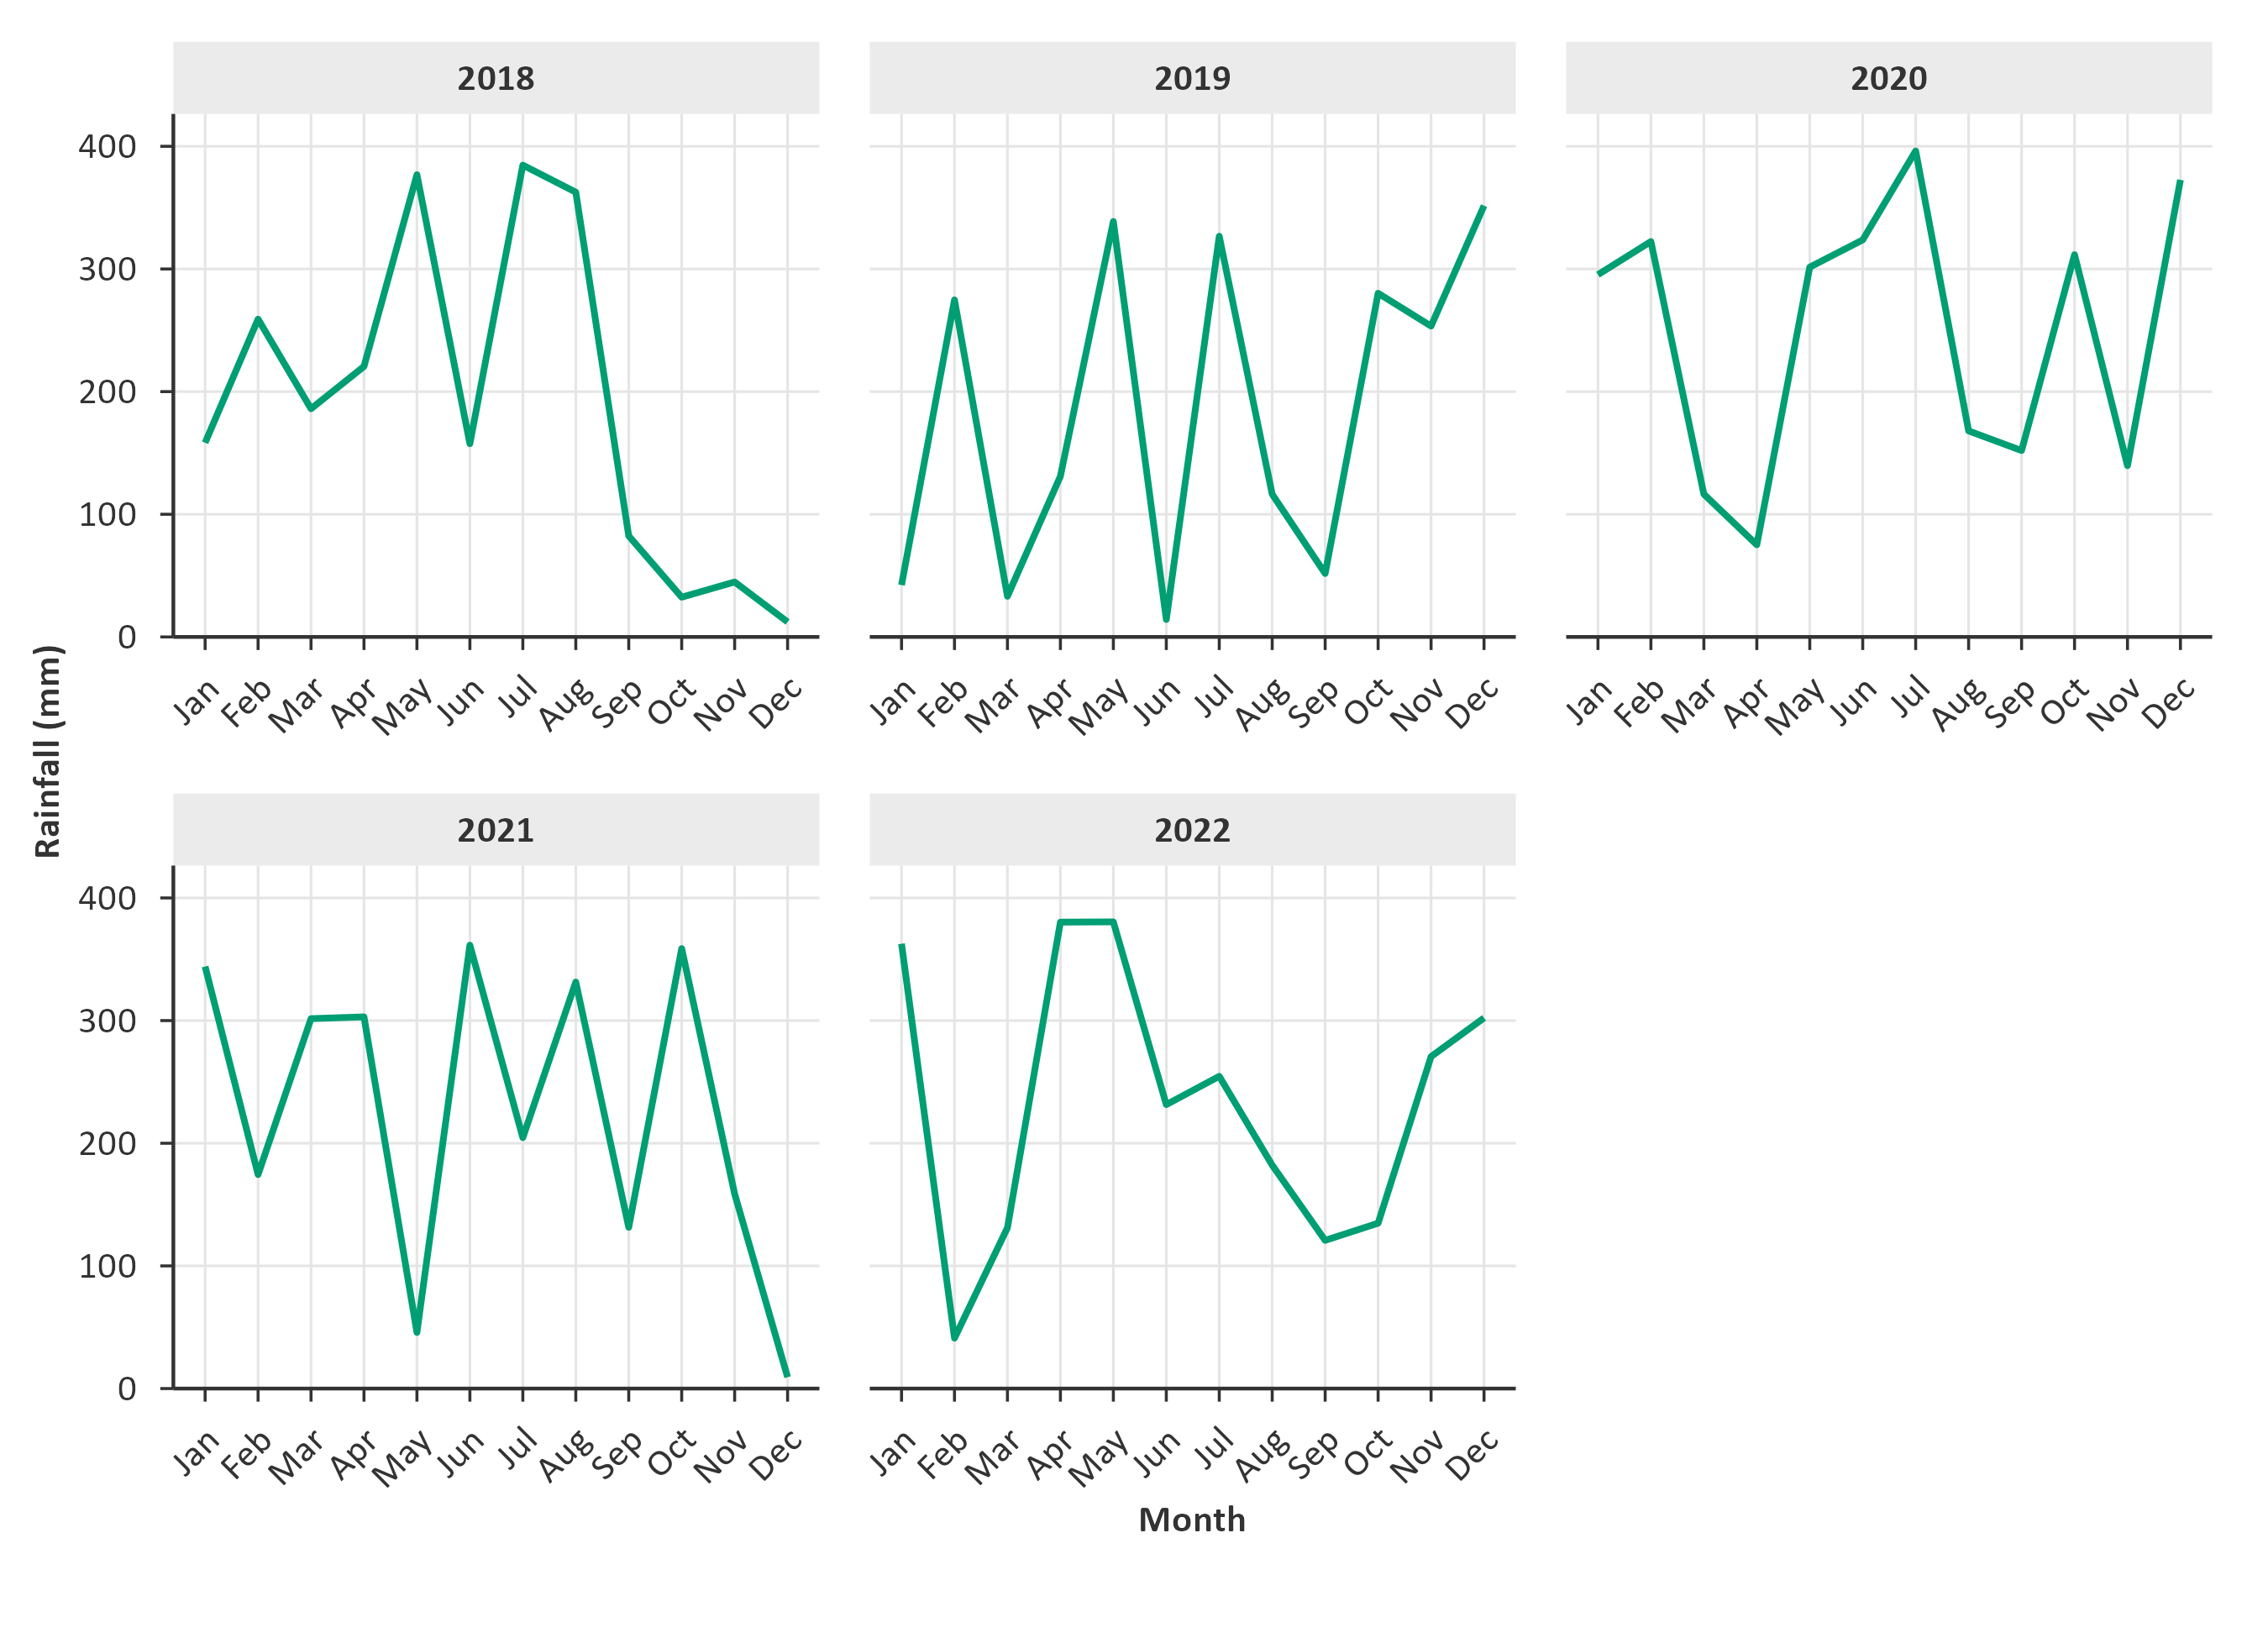
Figure 2. Monthly rainfall in Kisumu, Kenya, traced separately by year, 2018–2022. Source: CHIRPS (Climate Hazards Group).
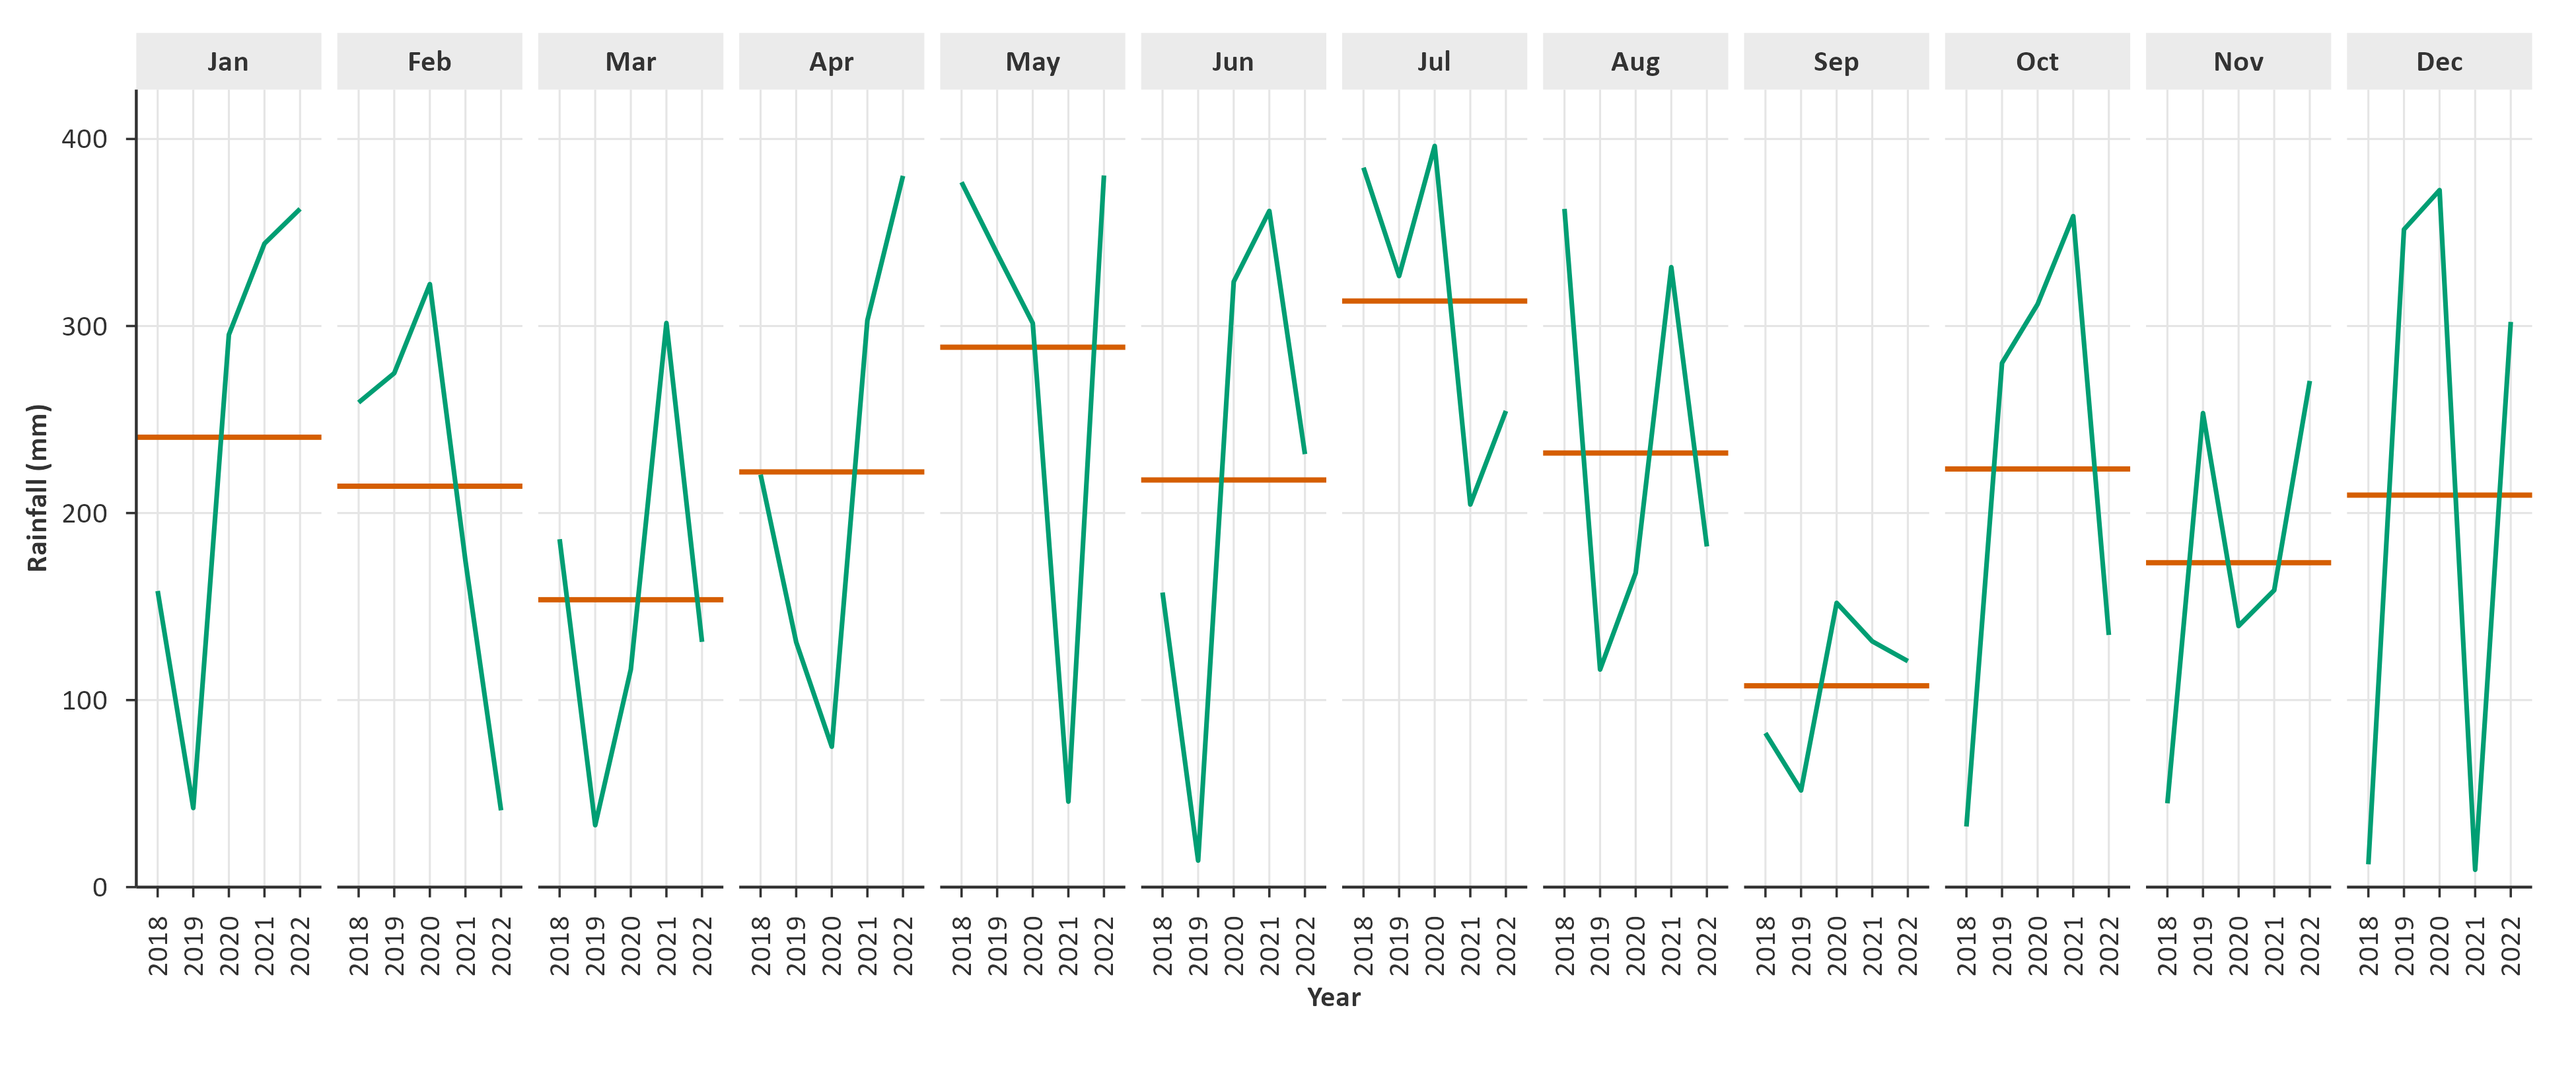
Figure 3. Monthly rainfall in Kisumu, Kenya, grouped by calendar month, 2018–2022. Orange line = that month's five-year average. Source: CHIRPS (Climate Hazards Group).
Figure 3 explains why some months are riskier to plan around than others. Of the 12 months, September receives the lowest monthly total rainfall on average. However, all five years’ totals land close to the mean value, making this driest month the most dependable month on record. On the contrary, total rainfall swings from below 100mm to about 300mm and above in majority of the months except for July and August which never dip below 100mm, and November, which stays under 300mm at the high end but still swings low. May, which is the second wettest month of the year on average and the last month of the main March-April-May (MAM) season in the region, dipped to below 100mm of rainfall, way below its 5 years average. This month (May) that matters most for planting is also the month where rainfall is hardest to predict from one year to the next.
What happened on the ground (May 2021)
Kenya's Ministry of Agriculture, Livestock, Fisheries and Cooperatives publishes a monthly Crop Conditions Bulletin. The May 2021 edition reported that in the Lower Nyanza region, which includes Kisumu, maize planted in mid-March had reached the tasseling and dough stages by May, its most water-sensitive point, when “there was early cessation of rains in mid-May.” It projected normal yields for the March-planted crops but below-average yields for crops planted later. This bulletin proceeds (on page 10) to show what preceded the cutoff; Kisumu weather station recorded 134% of its normal April rainfall. The sequence of events is therefore well-documented, i.e., an unusually wet April (also evidenced in Figure 2 and Figure 3), followed by an abrupt stop in mid-May.
Separating Signal from Noise
Seasonal and Trend decomposition using Loess (STL) decomposition splits the raw data into three parts including trend (the underlying long-term direction of the time series data; Osterrieder, 2023), seasonality (repeating patterns in the data, such as monthly or yearly patterns; Osterrieder, 2023), and remainder/noise (random fluctuations in the time series data that cannot be explained by the trend or seasonality; Osterrieder, 2023). Seasonal decomposition plots show more in-depth analysis of the data and identify patterns and trends that may not be apparent in basic plots.
Figure 4 shows all the three time series components while Figure 5 zooms into the seasonal piece alone, with all five years overlaid, to make its shape easier to read.
In Figure 4, the trend moves gently within a narrow band (roughly 140–255mm) with no long-term increase or decrease in rainfall across the five years. The remainder, which swings by more than 200mm with no obvious pattern, represents the part no seasonal calendar will forecast and the surprises layered on top of the normal rainy season. This is exactly the part a farmer still has to prepare for. One point in the remainder row is marked directly: May 2021's remainder is the single largest deviation anywhere in the five-year record, illustrating how an abnormal pattern looks like once trend and season are stripped away.
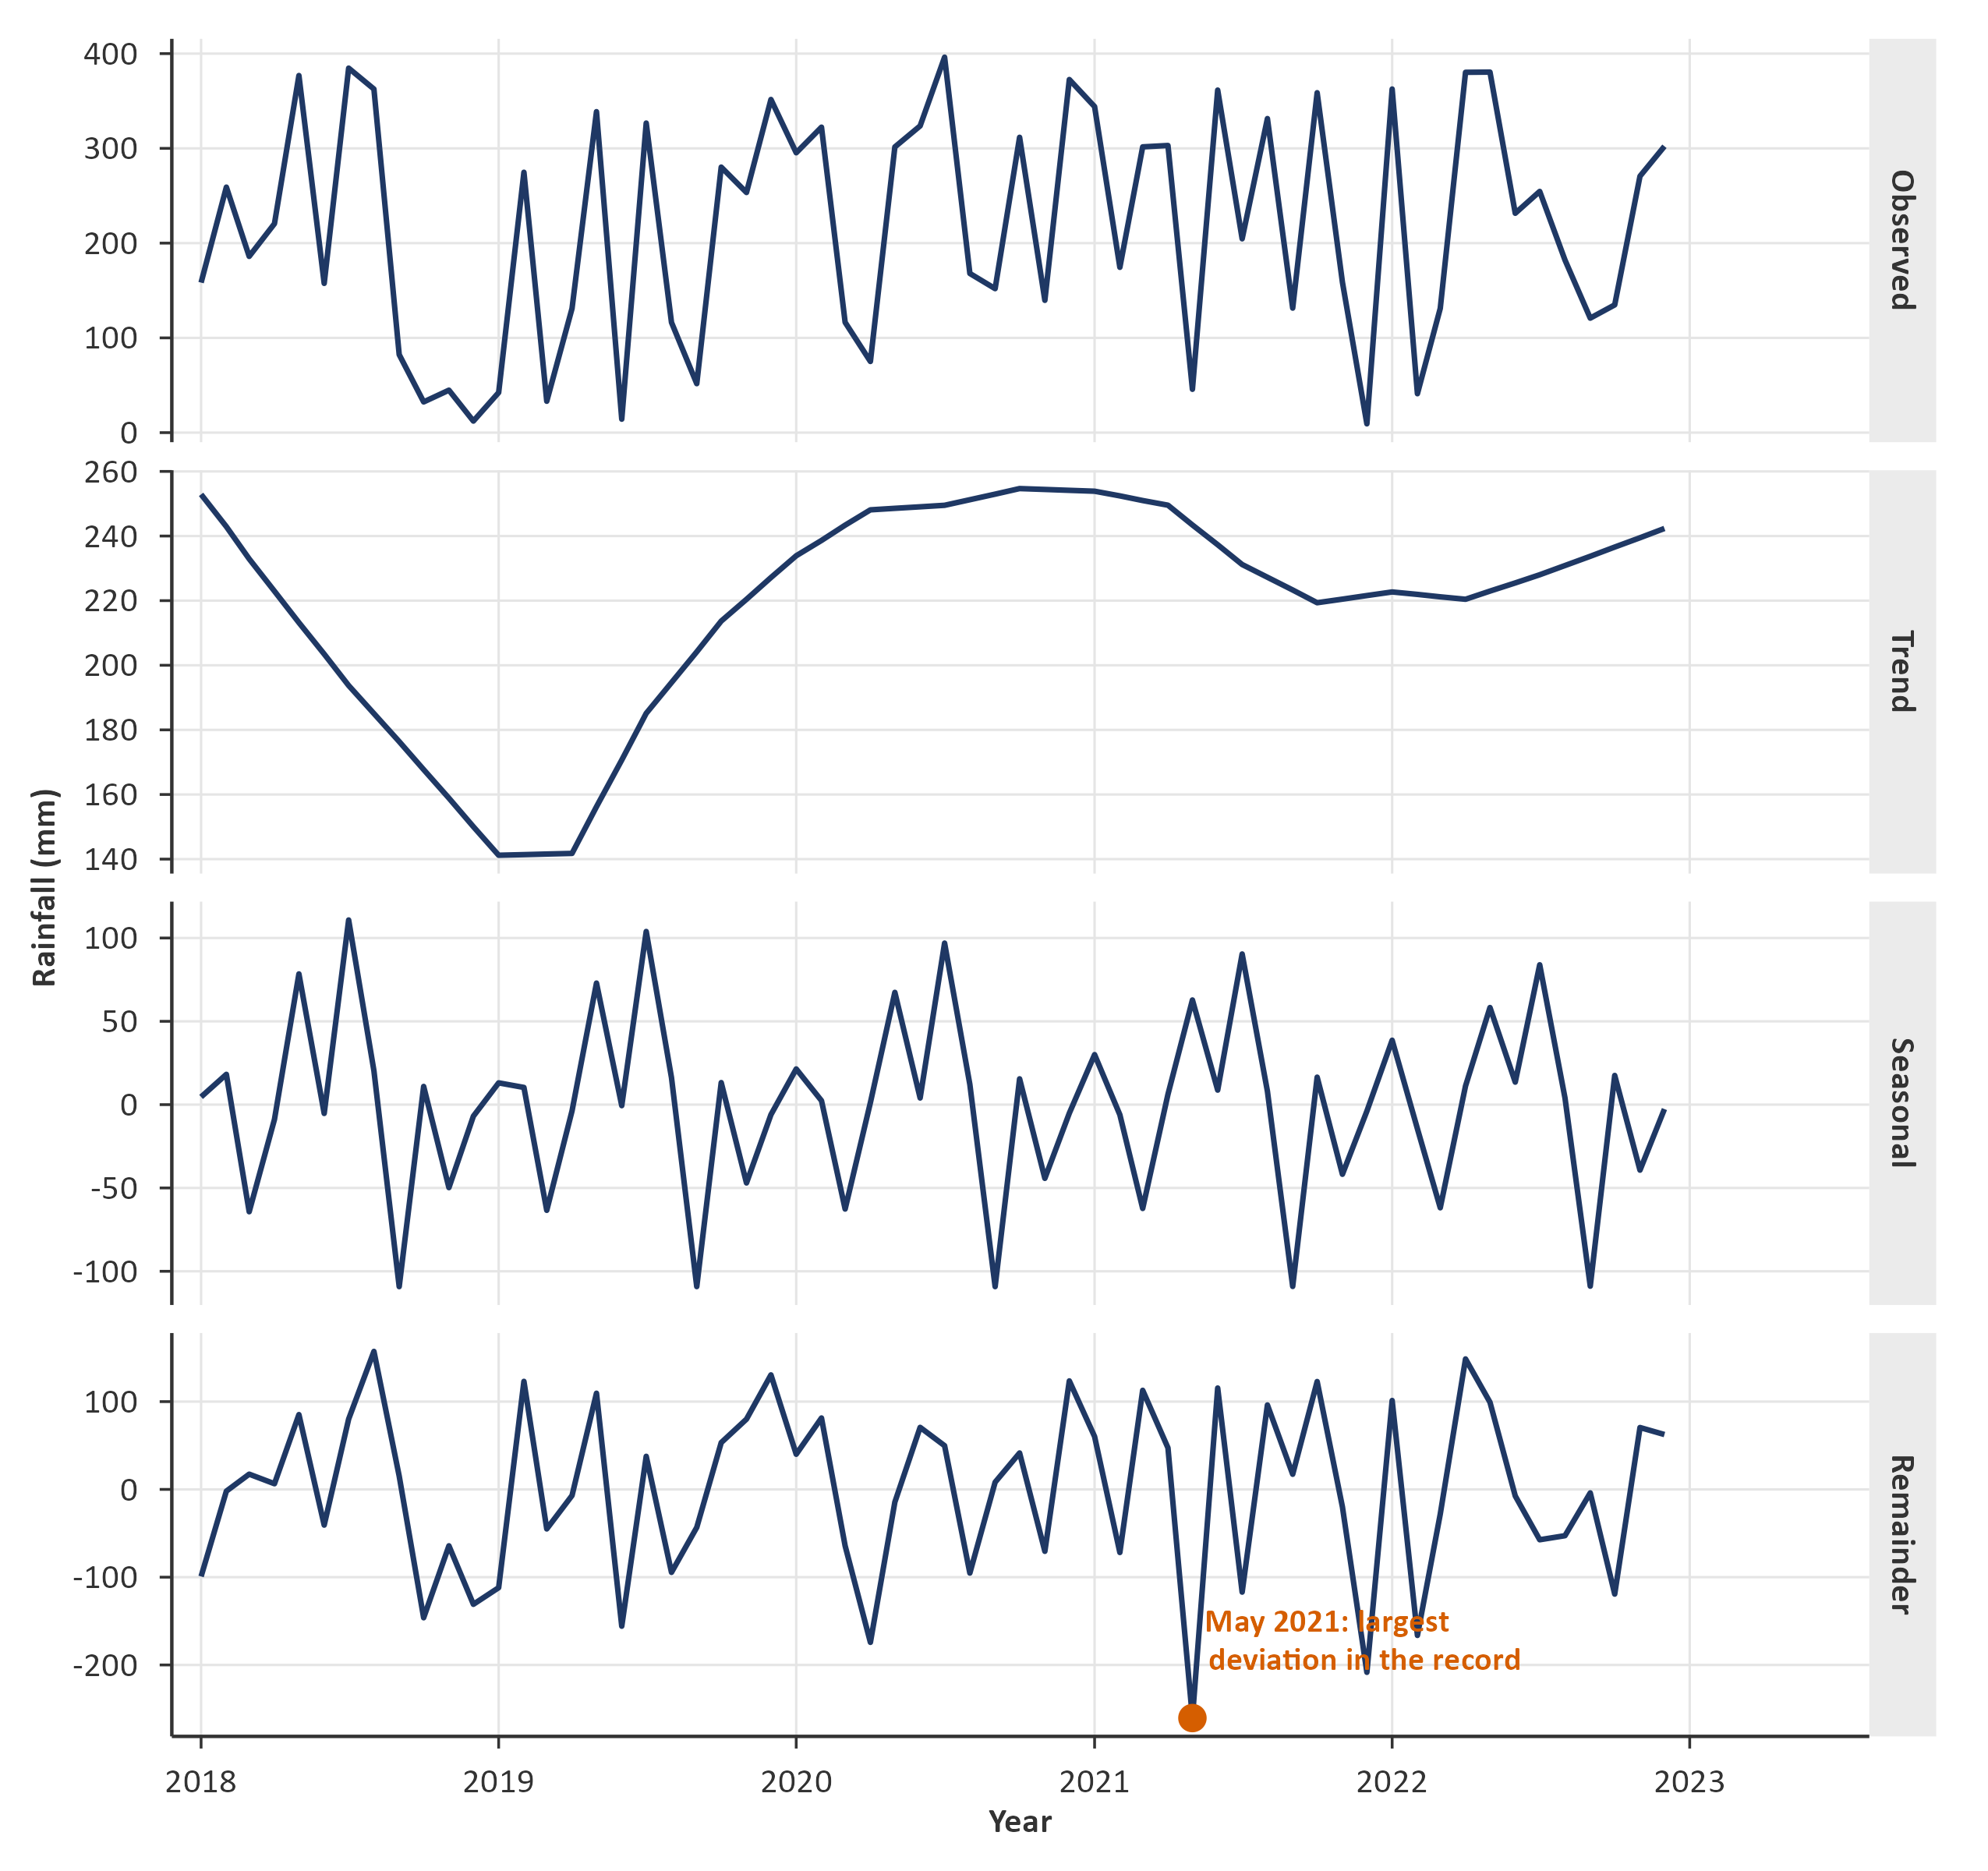
Figure 4. STL decomposition of monthly total rainfall in Kisumu, Kenya, 2018–2022 (observed = trend + seasonal + remainder). Source: CHIRPS (Climate Hazards Group).
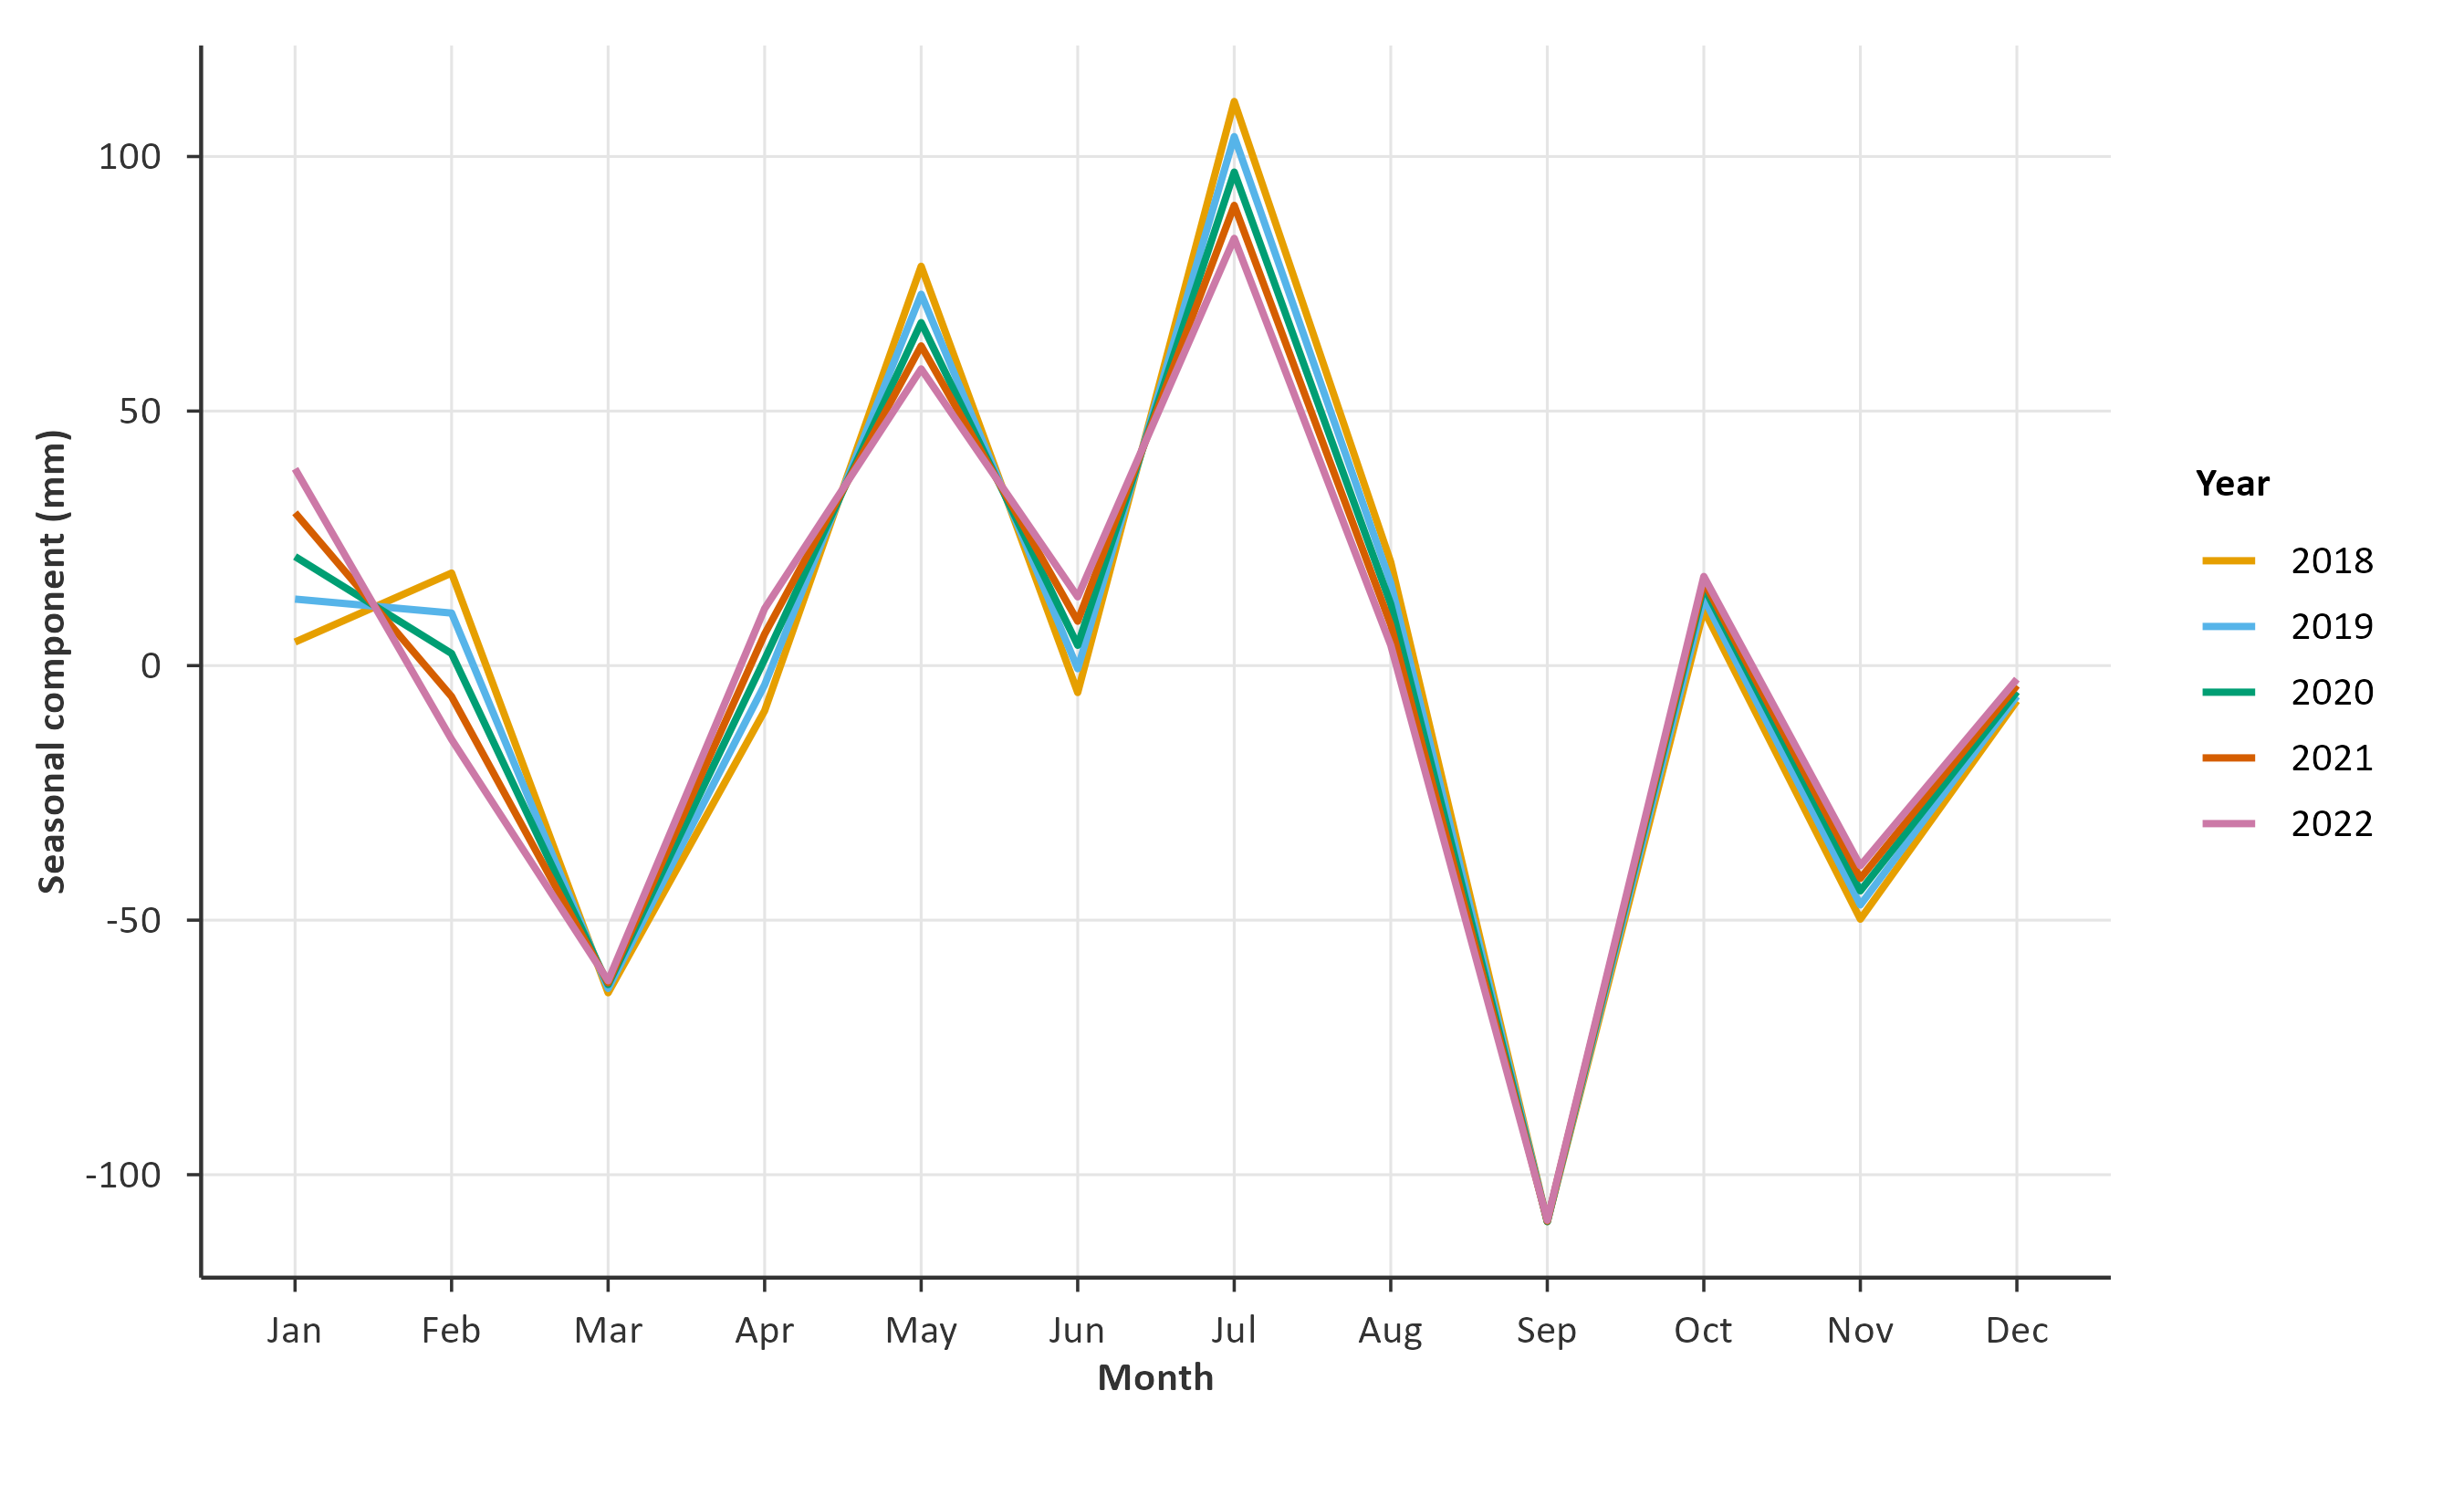
Figure 5. STL seasonal component of monthly rainfall in Kisumu, Kenya, by month, 2018–2022. Source: CHIRPS (Climate Hazards Group).
Figure 5 isolates the seasonal shape (from Figure 4) on its own, and it holds remarkably steady as every year traces the same March-trough, May-peak, July-peak, September-trough pattern. That stability is meaningful. Seasonality, by definition, “has an underlying cause” (Kolassa et al., 2023). In Kisumu's case, the region has long- and short-rains cycle, precisely what separates a genuine seasonal signal from statistical noise, since noise has no such cause to repeat. A seasonal plot like this one, overlaying one line per year, is designed specifically to reveal both the underlying pattern and any changes to seasonality across cycles (Kolassa et al., 2023). Looking closely at Figure 5 reveals a subtle shift hiding inside that shape, i.e., July has gotten slightly less rainy each year from 2018 to 2022, while January has gotten slightly more rainy year from 2018 to 2022. Although five years isn't enough data to call it a real trend yet, it's worth keeping an eye on such patterns.
What this means
-
September is the most dependable month on record; it is consistently dry with the least year-to-year variation.
-
May brings the second-most rain on average, but it's also one of the most variable, ranging from under 50mm to over 350mm across the five years. This is exactly the kind of month farmers rely on most yet one of the hardest to forecast. This matches farmer-reported behavior in a 2025 baseline survey across Kisumu County. The survey found that irrigation activity for key crops is lowest in May (Wanjau et al., 2025), a farmer-reported indicator of the same seasonal risk pattern found in the rainfall record.
-
Seasonal averages describe a typical year, but they don't describe a particular year. May 2021 is the clearest case - on paper, an average May looks like a safe planting month, but that year's actual rainfall broke sharply from it. If advisories lean only on long-term averages, anomalies like this go undetected until it's too late to act. Monitoring rainfall as the season progresses, not just checking it against the seasonal norm, is what gives you the lead time to flag a bad season early and adjust guidance to farmers before the damage is done.
Findings from this blog line up closely with T-CSIA's (Targeted Climate-Smart Irrigation Advisory Using Integrated Climate Indicators) own work. T-CSIA's historical index, built on 44 years of data, already identifies eastern Kisumu, especially the lower Nyando basin, as a persistent hotspot of irrigation-related water stress. This blog's independent analysis, using a different method and a more recent five-year window, arrives at a consistent picture, i.e., rainfall in this area follows a real seasonal pattern, but its timing within that season is genuinely hard to predict. May 2021 offers some concrete, dated, on-the-ground example of exactly the kind of risk T-CSIA's index is designed to flag.
Data & Resources
CHIRPS daily rainfall estimates (2018–2022), via the Digital Earth Africa CHIRPS registry.
Every source behind this piece - CHIRPS, the Ministry of Agriculture bulletin, the T-CSIA report, is openly published; nothing here draws on private or restricted data.
The team

Aniruddha Ghosh
Senior Scientist
Pedro Anglaze Chilambe
Research Team leader, Climate Finance
Anastasia Wahome
Research Team Leader
Chris Miyinzi Mwungu
Postdoctoral Fellow
Benson Kenduiywo
Research Specialist
Felix Otieno
Senior Research Associate-Impact Evaluation
Agnes Njambi Wanjau
Data AnalystReferences