Blog El Niño is here! What is it, and what can we do?

On July 4th 2023, the World Meteorological Organization - WMO, a technical agency of the United Nations - announced that conditions are in place for the El Niño phenomenon [1]. There has long been expectation of the arrival of El Niño, occupying news headlines and generating a sense of uncertainty due to images of its potentially devastating effects.
With the confirmation of the arrival of El Niño, it is important to understand what this phenomenon is, as well as its implications. The El Niño phenomenon will be explained by answering five questions, followed by options for mitigating its effects, mainly in the agricultural sector.
What is the El Niño phenomenon?
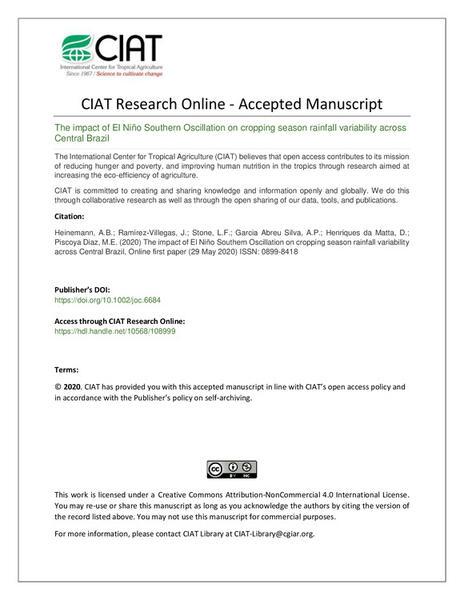
El Niño is a natural phenomenon that occurs due to the combination of an increase in temperature in the equatorial Pacific Ocean (oceanic variable) [2], low atmospheric pressure and the weakening of the winds that are responsible for 'dispersing' these warm waters in the Pacific (atmospheric variable). The combination of these variables causes a temporary increase in the temperature of the planet, which in turn generates important climatic variations across the world [3][4], which translates into droughts, floods, hurricanes, fires, landslides, and more. This phenomenon can last between 9 to 12 months, and can take place every 2 to 7 years, making the phenomenon cyclical but not periodic [5].
Schematic diagrams of El Niño, Normal and La Niña conditions. Source: PMEL - NOAA [6].
The graph shows that the interaction between oceanic and atmospheric variables can result in one of three phases: El Niño when the ocean is unusually warm; a neutral phase when conditions are relatively normal, with a balance between warm and cold waters; and a cold phase, called La Niña, when the equatorial Pacific Ocean is unusually cold.
How is El Niño related to climate change?
To answer this question, we need to clarify two definitions: climate variability and climate change. 'Climate variability' refers to changes and variations in climate on very specific time scales (days, weeks, months, seasons or years), whose causes may be natural or caused by human activity [7]. Climate change, on the other hand, is the set of measurable variations in the state of the climate that persist over a longer time scale (more than 10 years), which can also be caused by natural internal processes, but whose intensity of variation is attributable to human activities [7].
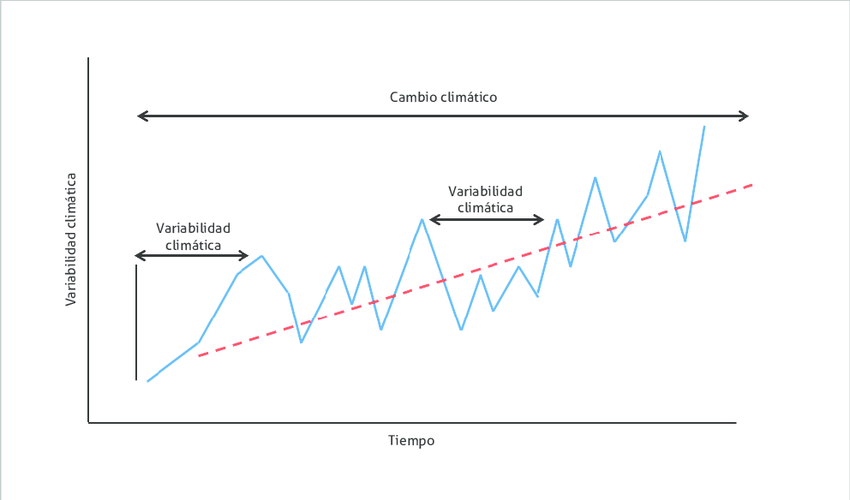
Exemplification of the difference between climate variability and climate change. Source: Baigún, C. [8].
As shown in the graph, climate variability indicates the changes that the climate undergoes during a specific period, while climate change is the accumulation of variations that, due to the influence of human activity, causes a gradual growth of the planet's temperature (although not explicitly shown in the graph, the average planetary temperature could be illustrated with the red dotted line).
With these definitions in mind, what is the relationship between the El Niño phenomenon and climate change? El Niño is a natural phenomenon, which due to its characteristics generates episodes of climate variability, since it alters weather patterns during a given time, but whose cause is not climate change (due to the fact that it is a natural phenomenon). However, there are reasons to suggest that the intensity of El Niño does increase due to climate change [9][4]. To illustrate this relationship, let us consider that the temperature of the planet is gradually increasing due to climate change, and that when El Niño occurs the temperature of the planet also increases, though temporarily. Due to climate change, the planet's baseline temperature (before the onset of El Niño) is higher and higher, resulting in increasingly intense episodes with the onset of El Niño.
What are the effects we can expect from El Niño in 2023?
As this is a phenomenon that alters weather patterns across the world, the answer will depend on where you ask. The following graph shows the typical impacts that El Niño could have on precipitation. Although it is common to associate El Niño with heat and dry weather (droughts, fires, decreased rainfall, etc.), there are parts of the world where the opposite effect occurs (excess rainfall, floods, landslides, etc.).

Typical precipitation during El Niño. Source: Columbia Climate School [10].
The graph shows the typical or average distribution of rainfall during an El Niño episode, (not a prediction of the actual phenomenon), illustrating how high and low rainfall converge and coexist. To gather more precise information about the expected effects in a particular geographic area, it is important to consult the forecasts of local and/or national meteorological authorities.
In Colombia, IDEAM models regarding precipitation predict that for the period between October and December 2023, we can expect:
"decreases between 10% and close to 40% in La Guajira, northern Magdalena, northern and central Cesar, central Bolivar, Norte de Santander, Arauca and Casanare foothills, Cundiboyacense foothills, northeastern Caldas, northern Antioquia, Choco, eastern Valle, southern Tolima and central Cauca. However, for Nariño, precipitation above historical values is expected between 20% and 40% and between 10% and 20% for southern Putumayo and the Amazonian trapezoid. In the rest of the country, rainfall records close to climatological averages are expected."[11].
Many will ask themselves: Will El Niño affect me? Most probably yes, it will affect everyone, since the most affected sectors are agriculture, energy and health - sectors that affect everyone, either directly or indirectly. In the case of the agricultural sector, as food production is highly dependent on and vulnerable to climate variations, planting and harvesting cycles can be affected, the level of rainfall can flood or dry crops, and temperature changes can cause diseases and pests. This, together with low yields or loss of crops, leads to shortages and higher prices, threatening food security.
In the case of the energy sector, many countries generate more than half of their energy from river power (hydroelectric plants). Both low rainfall and high temperatures affect river flow, and hydroelectric plants will not be able to produce the required levels of energy. This translates into possible rationing of the electric service and/or an increase in its price due to the need to resort to other more expensive sources.
On the other hand, El Niño also has an impact on health, as temperature changes cause an increase in mosquito-borne diseases (dengue, malaria, yellow fever, chikungunya, etc.) and water-borne diseases (diarrhea, leptospirosis, cholera, etc.). Similarly, there is an increase in respiratory diseases due to air conditions (acute respiratory infections), and nutritional diseases due to the low level of food supply and nutrients available in food (malnutrition) [12].
When would the effects of El Niño start to be felt more strongly?
In some regions, the effects of El Niño are already being felt. However, it is a gradual phenomenon, which will intensify with the passing of the remaining months of 2023. It is a gradual process because, in cases where the effects are dry periods, for example, it begins with a decrease in rainfall, which, as it becomes scarce and the temperature increases, droughts begin to form, which could later lead to fires, and with them to the loss of crops, livestock, biodiversity and other economic losses. Models do not yet provide an exact duration or intensity for 2024, but it is expected to be "at least moderate", with peaks of intensity that may vary over time, depending on geographic location.
While El Niño will bring many challenges to various economic sectors, there are tools that can be used and measures that can be taken to reduce its negative effects. In the case of the agricultural sector, we have information on measures that can be implemented to reduce some of the effects of this phenomenon.
The Alliance of Bioversity International and CIAT is already addressing some of the measures to adapt to the climatic impacts, and to address sustainable rural development in general, based on research and field work from which practices and technologies have been co-developed, tested and validated in several countries in Latin America and the Caribbean, and across the world. In general, recommendations for the agricultural sector include:
- Make use of agroclimatic information: Experts call for the identification of agroclimatic services provided or applicable for each territory (in Annex 1 you will find links to the bulletins of the main meteorological authorities in the region). Accurate and timely information combined with valuable recommendations allows agricultural producers to make better decisions on the management of their farms and crops [2][13].
The Agroclimatic Technical Tables - ATT2 and their bulletins are an example of valuable tools, since they not only offer climate forecasts, but also translate and transform them into specific recommendations for each context, i.e., for specific crops and territories. Currently, in Latin America and the Caribbean there are more than 60 MTAs in operation, empowering more than 420 institutions and benefiting more than 500,000 corn, bean, rice, coffee, vegetable, fruit and livestock farmers. In territories where there are not yet any established ATTs, it is recommended to check with the local authority for the availability of this service.
- Implementation of Sustainable Agriculture Practices Adapted to Climate - SAPAC: The second recommendation is to consult the SAPAC Implementation Manual [14]. This manual3 collects and compiles the results of the implementation of the Sustainable Territories Adapted to Climate (STAC), offering a portfolio of measures, a complete guide for the implementation of practices designed and tested for the Central American territory including costs, step-by-step guidelines, and a list of benefits. These practices are designed to be implemented both in the productive systems (with biopreparations, improved varieties or shade management), and indoors (wood-saving stoves), on-site (water harvesting on roofs) and outside houses (water reservoirs or roofed vegetable gardens).
The STACS are an approach promoted since 2016 by the CGIAR Research Program on Climate Change, Agriculture and Food Security (CCAFS), and which were promoted in Olopa (Guatemala)[4] and Santa Rita (Honduras)[5], and municipalities located in the Central American Dry Corridor[6]. In short, STACs are territories where agroclimatic information is used to improve crop adaptation, increase mitigation, productivity and food security of the families and communities involved in these processes. To this end, the 'Participatory Integrated Climate Services for Agriculture' or PICSA[7] approach is used - a participatory methodology that enables farmers to make better decisions based on the understanding and use of climate and weather information specific to their location and type of crop.
Some of the other tools available include:
- aCLIMAtar[8] application, which provides climate data and information on suitability, gradient and recommended practices in cacao and coffee for Honduras, El Salvador, Guatemala, Nicaragua and Dominican Republic.
- Aclimate[9] application, which provides climate and agroclimatic forecasts for corn and rice crops in different locations in 10 regions in Colombia.
- Melisa chatbot[10], software that allows farmers to converse with the chatbot through social networks such as Whatsapp, Facebook and Telegram, answering agroclimatic questions and offering recommendations for corn and rice crops based on data provided by the Aclimate application.
The effectiveness of using these tools and implementing SAPAC practices will depend on several factors, including primarily crop type and geographic conditions. Although many of the practices listed in the SAPAC Manual are simple practices that can be implemented on a variety of farms regardless of crop type, they are highly effective, and it is good to consult crop-specific recommendations. The research of the Alliance of Bioversity International and CIAT has focused on beans[11], cassava, rice and tropical forage crops, and with the help of key partners, these crops extend to maize, coffee and musaceae bananas, for example.
In conclusion, there are different science-based options for dealing with El Niño and minimizing its impacts on the agricultural sector. Agroclimatic forecasts are proof of this, as they are highly useful tools when information is used to identify opportunities and implement preventive measures, such as the use of rainwater before the dry season begins.
Anexo 1
Pronósticos y boletines oficiales sobre El Niño
Fuentes Internacionales:
• Organización Meteorológica Mundial (OMM):
Página oficial: https://public.wmo.int/es/el-ni%C3%B1ola-ni%C3%B1a-hoy
Compilación de boletines: https://ciifen.org/el-nino-la-nina-omm/
• Centro Internacional para la Investigación del Fenómeno de El Niño (CIIFEN): https://ciifen.org/el-nino-la-nina-ciifen/
• International Research Institute for Climate and Society (IRI): IRI – International Research Institute for Climate and Society | June 2023 Quick Look (columbia.edu)
• National Oceanic and Atmospheric Administration (NOAA): https://www.cpc.ncep.noaa.gov/products/precip/CWlink/MJO/enso.shtml
• Centro Clima – portal regional del Sistemas de la Integración Centroamericana – SICA: https://centroclima.org/
Algunos pronósticos y boletines Nacionales:
• México – Servicio Meteorológico Nacional (SMN): https://smn.conagua.gob.mx/es/climatologia/diagnostico-climatico/estatus-del-nino
• Guatemala – Instituto Nacional de Sismología, Vulcanología, Meteorología e Hidrología (INSIVUMEH): https://insivumeh.gob.gt/?page_id=32
• El Salvador – Servicio Nacional de Estudios Territoriales (SNET): https://www.snet.gob.sv/ver/meteorologia/pronostico/boletin+enos+el+nino/
• Honduras – Comité Permanente de Contingencias (COPECO): https://copeco.gob.hn/
• Nicaragua – Instituto Nicaragüense de Estudios Territoriales (INETER): https://www.ineter.gob.ni/index.html
• Costa Rica – Instituto Meteorológico Nacional de Costa Rica (IMN): https://www.imn.ac.cr/pronostico-climatico
• Panamá – Instituto de Meteorología e Hidrología de Panamá (IMHPA): https://www.imhpa.gob.pa/es/el-nino-oscilacion-del-sur-enos
• Colombia - Instituto de Hidrología, Meteorología y Estudios Ambientales (IDEAM): http://www.ideam.gov.co/web/tiempo-y-clima/clima/fenomenos-el-nino-y-la-nina
• Ecuador – Instituto Nacional de Meteorología e Hidrología (INAMHI): https://www.inamhi.gob.ec/Front_productos/productos_pronosticos.html
• Perú – Servicio Nacional de Meteorología e Hidrología del Perú (SENAMHI): https://www.senamhi.gob.pe/?&p=fenomeno-el-nino
References
[1] World Meteorological Organization (2023). World Meteorological Organization announces the prevalence of conditions that may indicate the onset of an El Niño episode. [Press release]. Available at: https://public.wmo.int/es/media/comunicados-de-prensa/la-organización-meteorológica-mundial-anuncia-la-prevalencia-de-unas (Accessed: July 04, 2023).
[2] World Meteorological Organization (2023). El Niño/La Niña Today - Bulletin April 2023. Available at: https://filecloud.wmo.int/share/s/jTVN8TemRveiPDHshNC1Uw (Accessed: 05 June 2023).
[3] CIIFEN (No date). El Niño Southern Oscillation. Available at: https://ciifen.org/el-nino-oscilacion-del-sur/ (Accessed: 05 June 2023).
[4] Johnson, N. A boost in big El Niño. Nature Climate Change 4, 90-91 (2014). https://doi.org/10.1038/nclimate2108
[5] Guevara Díaz, J. M. (2008). The ABC of the indices used in the identification and quantitative definition of El Niño-Southern Oscillation (ENSO). Terra Nueva Etapa, vol. XXIV, no. 35, January-June, 2008, pp. 85-140. Universidad Central de Venezuela. Caracas, Venezuela. Available at: http://www.catedras-bogota.unal.edu.co/catedras/gaitan/2016-II/gaitan_2016_II/docs/lecturas/s02/ABCIndicesENSO.pdf
[6] Pacific Marine Environmental Laboratory - PMEL - NOAA. (sf). Schematic diagrams of El Niño, Normal and La Niña conditions. Available at: https://www.pmel.noaa.gov/elnino/schematic-diagrams (Accessed: July 04, 2023).
[7] IPCC. (2018). Annex I: Glossary [Matthews J.B.R. (ed.)]. In: 1.5 °C global warming, IPCC Special Report on the impacts of 1.5 °C global warming relative to pre-industrial levels and corresponding trajectories that global greenhouse gas emissions should follow, in the context of strengthening the global response to the threat of climate change, sustainable development and poverty eradication efforts [Masson-Delmotte V., P. Zhai, H.-O. Pörtner, D. Roberts, J. Skea, P.R. Shukla, A. Pirani, W. Moufouma-Okia, C. Péan, R. Pidcock, S. Connors, J.B.R. Matthews, Y. Chen, X. Zhou, M.I. Gomis, E. Lonnoy, T. Maycock, M. Tignor, and T. Waterfield (eds.)]. Available at: https://www.ipcc.ch/site/assets/uploads/sites/2/2019/10/SR15_Glossary_spanish.pdf (Accessed: 30 June 2023).
[8] Baigún, C. R. M. (2016). Guidelines and concepts for the adaptation of river fisheries in the La Plata Basin to climate change. Fundación Humedales / Wetlands International. Buenos Aires, Argentina. Available at: https://www.researchgate.net/publication/301553611_Lineamientos_y_conceptos_para_la_adaptacion_de_ las_pesquerias_fluviales_de_la_Cuenca_del_Plata_al_cambio_climatico (Accessed: 04 July 2023).
[9] World Meteorological Organization (2014). El Niño/Southern Oscillation. WMO - No. 1145 Available at: https://library.wmo.int/?lvl=notice_display&id=16749 (Accessed: 05 June 2023).
[10] Columbia Climate School. (2023). El Niño and rainfall. ENSO Resources, International Research Institute for Climate and Society, Columbia University. Available at: https://iri.columbia.edu/wp-content/uploads/2023/05/ELNINO-RAINFALL-2023.pdf (Accessed: 04 July 2023).
[11] IDEAM (June, 2023). Informe de Predicción Climática a corto, mediano y largo plazo en Colombia. Grupo de Modelamiento de Tiempo y Clima, Subdirección de Meteorología - IDEAM. Available at: http://bart.ideam.gov.co/wrfideam/new_modelo/CPT/informe/Informe.pdf (Accessed: 05 July, 2023).
[12] Pan American Health Organization. (2000). El Niño Phenomenon, 1997-1998. Disaster Chronicles Series, 8. Washington, D.C. 294 pp. Available at: https://iris.paho.org/handle/10665.2/46050 (Accessed: July 04, 2023).
[13] CRRH-SICA. (2023). Climate outlook and agriculture in the SICA region - Specialized Roundtable on Agriculture and Coffee- LXXI Forum on the Application of Climate Forecasts to Food and Nutritional Security (SAN) - May, June and July 2023. Available at: https://www.cac.int/sites/default/files/documentosdedescarga/Infografía Mayo 2023.pdf (Accessed: 05 June 2023).
[14] López, C. Álvarez O., Martínez-Salgado, J.D., Guevara, M., Ortíz, L. & Martínez Barón, D. 2021. Manual for the implementation of Sustainable Agriculture Adapted to Climate (ASAC) practices. Experiences from the TeSACs of Guatemala and Honduras Version 2. 2022. CGIAR Research Program on Climate Change, Agriculture and Food Security (CCAFS). Available at: https://repositorio.iica.int/handle/11324/21060
FAQs about El Niño
1. How do the recommended measures for mitigating El Niño's effects in agriculture cater to various regions and crops?
The recommended measures for mitigating El Niño's effects in agriculture are tailored to address the specific needs and challenges of different regions and crops. These measures take into account factors such as varying climate conditions, soil types, and crop varieties, ensuring that farmers can adapt strategies according to their local context. By providing agroclimatic information and promoting sustainable agriculture practices adapted to climate change – such as water harvesting techniques and crop diversification – these measures aim to enhance resilience and minimize the negative impacts of El Niño on agricultural production across diverse landscapes.
2. Are there case studies demonstrating the effectiveness of suggested tools in minimizing El Niño's impact on farming?
There are indeed case studies illustrating the effectiveness of suggested tools in minimizing El Niño's impact on farming. These case studies demonstrate how the implementation of agroclimatic forecasts and sustainable agriculture practices has helped farmers mitigate the adverse effects of El Niño, such as droughts, floods, and extreme temperatures. By utilizing climate information to inform decision making and adopting resilient agricultural practices, farmers have been able to maintain productivity, protect crops from weather-related risks, and ensure food security even during El Niño events.
3. What are the long-term strategies for building agricultural resilience to future El Niño occurrences?
The long-term strategies for building agricultural resilience to future El Niño occurrences involve a multifaceted approach. These strategies include investing in research and development to enhance climate resilience in crops, promoting sustainable land management practices to improve soil health and water retention, and strengthening agricultural infrastructure to withstand extreme weather events. Additionally, there is a growing emphasis on building capacity among farmers to adapt to changing climate conditions through training programs and extension services. By integrating these long-term strategies into agricultural policies and practices, stakeholders can work towards building a more resilient agricultural sector capable of withstanding the impacts of El Niño and other climate-related challenges over time.